This report is one of a series on the adjustments we make to convert GAAP data to economic earnings.
Reported earnings don’t tell the whole story of a company’s profits. They are based on accounting rules designed for debt investors, not equity investors, and are manipulated by companies to manage earnings. Only economic earnings provide a complete and unadulterated measure of profitability.
Converting GAAP data into economic earnings should be part of every investor’s diligence process. Meeting the challenge of performing detailed analysis of footnotes and the MD&A is a fiduciary responsibility.
We’ve performed unrivaled due diligence on 5,500 10-Ks every year for the past decade.
Asset write-downs are unusual charges that don’t appear on the income statement because they are bundled in other line items. Without careful footnotes research, investors would never know that these non-recurring items distort operating earnings by overstating core-operating costs.
Our models remove this distortion to reveal a company’s recurring, core-operating profitability or NOPAT.
Write-downs are also a form of shareholder equity destruction as they artificially reduce the carrying value of assets reported on the balance sheet. In turn, they also artificially boost profitability metrics like return on assets by lowering the denominator. Our models always capture the after-tax value of asset write-downs in our measure of invested capital, the denominator in our return on invested capital (ROIC) calculation.
This report focuses on the impact of hidden asset write-down expenses on net operating profit after tax (NOPAT), the numerator in our ROIC calculation. A future article will focus on its effects on invested capital. We will also dedicate another report to other (non-write-down) unusual items hidden in operating earnings.
As shown in Figure 1, Citigroup (C) had the largest adjustment to its operating earnings in 2012 from asset write-downs hidden in operating expenses. Our analysts found five instances in Citigroup’s 2012 Form 10-K of asset write-downs bundled in operating expenses. The most significant is a $4.7 billion loss on sale, as Citigroup sold its 35% stake in Morgan Stanley Smith Barney Holdings for $4.7 billion less than its reported carrying value.
The other hidden write-downs in 2012 included an additional loss on sale, and impairments of real estate, intangible assets, and corporate holdings.
Figure 1 shows our 2012 rankings for the five companies with the largest asset write-downs hidden in operating expenses and the five with the largest write-downs as a percent of revenues.
Figure 1: Biggest Offenders for Asset Write-Downs Hidden in Operating Expense or Revenue in 2012
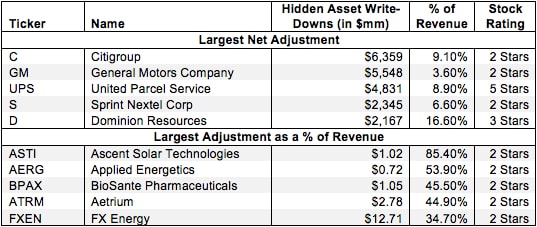 Sources: New Constructs, LLC and company filing
These companies are hardly the only ones whose earnings are affected by hidden asset write-downs. In fiscal year 2012, our analysts recorded 1,759 NOPAT adjustments for hidden asset write-downs for 1,226 different companies. Throughout the history of our coverage, asset write-downs hidden in operating items have been found 12,868 times for a total impact of over $294 billion.
Weighing the effect of asset write-downs hidden in operating expenses can be difficult for investors. On the one hand, the adjustment can make a company’s NOPAT significantly higher than its reported earnings. On the other hand, large amounts of write-downs indicate management’s failure to create value by allocating capital that declines in value. The companies with the five highest adjustments as a % of revenue all earn our Unattractive rating.
The only company in Figure 1 to earn an Attractive-or-better rating, UPS, had only one write-down. Difficulties with its Teamster pension plan, as well as very low interest rates, led to a $4.8 billion loss on the value of its pension plan. By adding this and other significant non-operating expenses back to NOPAT, we found that UPS had an after-tax operating profit of $7.5 billion in 2012, rather than the $807 million of reported net income. Investors just looking at reported earnings would have a misleading view of UPS’s profitability.
While such a large underfunding of the pension is some cause for concern, it is not large enough to offset the strong cash flows of the business. As a result, UPS earns our Very Attractive (5-Star) rating.
Still, the effect of asset write-downs can have a significant impact on the investment outlook for a company. All five companies in the bottom half of Figure 1 get my Unattractive (2-Star) rating, due in part to their low ROICs. Their ROICs are so low largely because we hold them accountable for earning a return on capital they have destroyed through asset write-downs. Per above, another report will focus on this topic.
FX Energy, Inc. (FXEN) is a good example of the impact of hidden asset write-downs in operating expenses. The oil company incurred a $12.7 million write-down in 2012 due to the drilling of dry oil wells. While we removed that loss from our calculation of NOPAT, we added the after-tax value of the $12.7 million write-down to invested capital. As a result, FXEN earns a very low ROIC of only 4%.
Removing hidden asset write-downs from operating expenses does not reward companies for bad investments, it just records the negative impact in a more accurate way. Our ROIC measures the recurring cash operating profits earned on all capital that has been invested in the operations of the business, even capital destroyed via asset write-downs.
Sam McBride contributed to this report
Disclosure: David Trainer and Sam McBride receive no compensation to write about any specific stock, sector, or theme.
4 replies to "Asset Write-Downs Hidden In Operating Earnings – NOPAT Adjustment"
Quick question. How do your analysts account for a company that is currently well-managed (say a new mgt team, strategy, etc.) versus prior mistakes by C-level execs. For example, large write-downs added back (after tax) to invested capital will be baggage forever-Right? However, a “clean-slate” mgt team may actually be generating an attractive ROIC–but doesn’t show up due to the excessively large denominator. In other words, can you track real-time ROIC that excludes past mgt mistakes? It could take years for this to show up in an acceptable ROIC. Probably not an often enough occurrence to dictate your attention, but just curious. BTW–love the work you guys do.
thx
JB
Good question JB. This is a question we’ve considered many times and continue to evaluate. For now, we’ve decided to add back all accumulated write-downs back to invested capital, but with enough transparency in our models and reports that investors can see the impact of these write-downs and make their own decisions on how to treat them.
Hi Sam, I do a bit of equities research in my own time, but I dont analyse financial statements anywhere near to the level of detail you guys do. I would like to get to your level however, and I’d be very interested to know of any books or other resources which you have found useful, specifically with regards to adjusting earnings numbers to the more real earnings numbers. At the moment I’ve got financial shenanigans and Quality of Earnings, but I was hoping you would have other suggestions that might improve my analysis of financial statements.
Cheers,
Eddie
Eddie,
I would recommend reading anything you can find by Michael Mauboussin, including his book “The Expectations Game” and his white papers that you can find here:
http://www.valuewalk.com/2015/12/michael-mauboussin-research-papers-from-credit-suisse-full-collection/
Also check out David Trainer’s chapter “Modern Tools For Valuation” in The Valuation Handbook.