
We closed this position on November 16, 2021. A copy of the associated Position Update report is here.
Check out this week’s Danger Zone interview with Chuck Jaffe of Money Life.
For long-term investors, now is an excellent time to buy leading businesses, with the cash flows and balance sheet to survive the downturn, at significant discounts. Investors overlooking Simon Property Group (SPG: $56/share) are in the Danger Zone. Investors willing to lift their gaze past the (inevitable and steep) dip in economic activity should consider this Long Idea for their portfolio.
SPG’s History of Profit Growth
SPG is down 62% year-to-date (YTD) and trades below its economic book value, or no-growth value, for the first time in the history of our model (dates back to 1998). The stock also currently offers a 15% dividend yield, and though that yield will likely drop in the near-term, it will remain higher than most. It’s not often investors get the opportunity to buy the strongest firm in an industry at such a discounted price.
Prior to the COVID-19 outbreak, SPG had a strong history of profit growth. Over the past decade, SPG grew revenue by 4% compounded annually and core earnings[1] by 23% compounded annually, per Figure 1. SPG has grown revenue by 6% compounded annually and core earnings by 11% compounded annually over the past two decades. The firm increased its core earnings margin year-over-year (YoY) in nine of the past ten years and its core earnings margin of 38% in 2019 is up from 8% in 2009.
Figure 1: SPG Core Earnings & Revenue Growth Since 2009
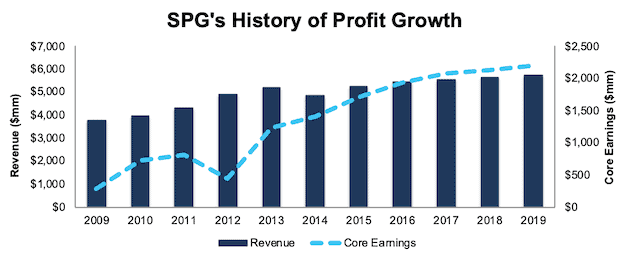
Sources: New Constructs, LLC and company filings
SPG leverages its strong retail portfolio and rising profitability to generate significant free cash flow (FCF). The company generated positive FCF in eight of the past 10 years and a cumulative $14.8 billion (79% of market cap) over the past five years. SPG’s $3.7 billion in FCF in 2019 equates to a 9% FCF yield, which is well above the Real Estate sector average of 0%.
Strong Balance Sheet Provides Ample Liquidity and Showcases Strength of Business
Simon Property Group recently announced that it amended and extended its existing $4 billion credit facility with a $6 billion credit facility, which may be increased to $7 billion. The facility includes a $4 billion revolving credit facility and a $2 billion term loan facility. The interest rate under the amended revolving facility was reduced to LIBOR plus 70 basis points from LIBOR plus 77.5 basis points.
In other words, SPG was able to attract more debt investors at a lower interest rate - a direct testament to the strength of SPG’s business in this volatile market.
As SPG’s CEO, David Simon, noted, “the newly refinanced $6 billion credit facility and term loan enhances our already strong financial flexibility, and when combined with our existing $3.5 billion senior unsecured credit facility provides us with $9.5 billion of total credit capacity.”
Further, SPG’s debt maturity profile is spread over multiple years, with just $3.2 billion maturing in 2020. If needed, SPG’s debt maturity in 2020 could easily be covered by their new credit facility even if rent payments dried up for the entirety of the year.
Own the Best - SPG Is the Most Profitable Mall Real Estate Investment Trust (REIT)
Before the stay-at-home and lockdown orders were issued across the globe, SPG’s profitability was trending higher while peers’ was declining. This superior profitability is a testament to the strength of SPG’s portfolio of malls and premium outlets and management’s capital allocation skill. We expect that SPG’s portfolio will return to its industry-leading ways once the COVID-19 restraints are lifted and consumers can shop, eat out, and enjoy social activities again.
Per Figure 2, SPG’s net operating profit after-tax (NOPAT) margin improved from 56% in 2015 to 58% in 2019. Meanwhile, the market-cap-weighted average NOPAT margin of SPG’s mall REIT peers has fallen from 33% to 29% over the same time. NOPAT is our adjusted version of funds from operations (FFO). Peers in the group include CBL & Associates (CBL), Pennsylvania Real Estate Investment Trust (PEI), Taubman Centers (TCO), The Macerich Company (MAC), Washington Prime Group (WPG), and Tanger Factory Outlet Centers (SKT).
Figure 2: SPG’s NOPAT Margin Vs. Peers
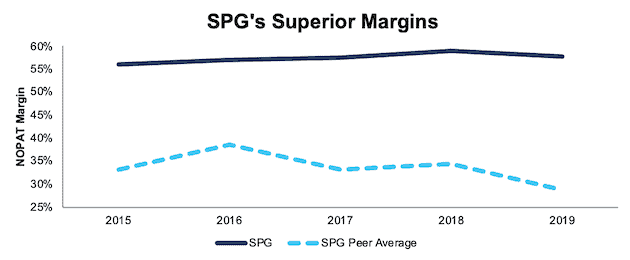
Sources: New Constructs, LLC and company filings.
SPG’s capital efficiency is also well above peers’. Per Figure 3, SPG slightly improved its invested capital turns from 0.19 in 2015 to 0.20 in 2019. Meanwhile, the market-cap-weighted average invested capital turns of peers remained stagnant at 0.14 over the same time.
Figure 3: SPG’s Invested Capital Turns Vs. Competitors
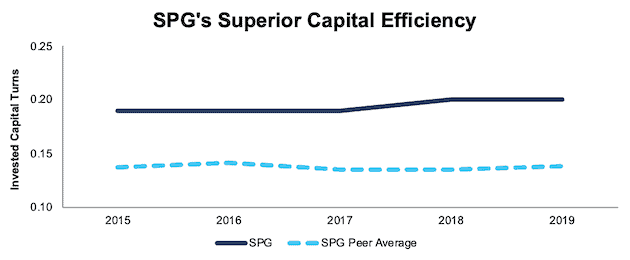
Sources: New Constructs, LLC and company filings.
The combination of rising margins and invested capital turns drives SPG’s ROIC higher. SPG improved its ROIC from 11% in 2015 to 12% in 2019. Per Figure 4, the market-cap-weighted average ROIC of peers actually fell from 5% to 4% over the same time.
Figure 4: SPG’s ROIC vs. Competitors
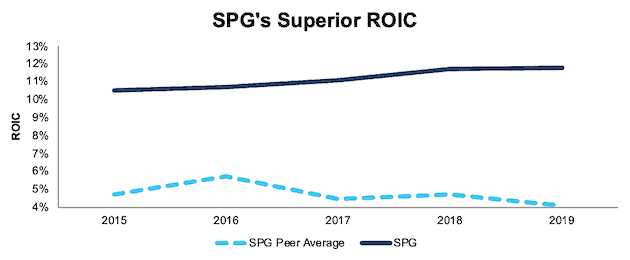
Sources: New Constructs, LLC and company filings.
SPG’s superior profitability shows that its investment in high-end mall properties and mixed-use facilities have helped build a highly profitable portfolio. Moving forward, SPG’s higher profitability allows the firm greater flexibility to survive the COVID-19 induced downturn while also investing for the future (such as the recent acquisition of Taubman Centers).
Bear Case Ignores SPG’s Strong Portfolio and Assumes the Death of Retail
While even the most ardent retail bears wouldn’t have predicted a global pandemic would be the latest strain on retail, they’ve long been calling for the death of traditional retailers and malls. We’ve pointed out in prior reports that the “Retail Apocalypse” narrative is hyperbole. Yes, there are certainly weak firms that cannot compete in the modern retail market, but investors should not assume all retailers, and therefore REITs, will meet the same fate. SPG’s portfolio of properties adds further evidence that the retail apocalypse does not apply to all firms.
If all malls and shopping centers were dying, one would expect declining sales and large vacancies. SPG’s portfolio, with 96% of properties in the top 10 largest economies, bucks that expected trend. Per Figure 5, the average sales per square foot of SPG’s U.S. mall portfolio has increased from $603/sq. foot in 2012 to $693/sq. foot in 2019.
Figure 5: SPG’s U.S. Mall Portfolio Sales Per Square Foot
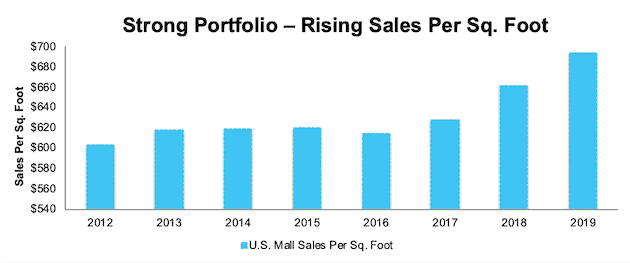
Sources: New Constructs, LLC and company filings
SPG’s portfolio also has a significantly lower vacancy rate, and therefore higher occupancy rate, than the national average. According to Reis Moody’s Analytics, the U.S. mall vacancy rate reached 9.7% at the end of 2019. By comparison, SPG’s U.S. vacancy rate was nearly half, at 4.9%. Its U.S. occupancy rate of 95.1% in 2019 is just slightly below its 95.4% average since 2009.
Government Assistance Could Provide Retailers Relief
The U.S. government has provided significant relief to individuals and small businesses through the Coronavirus Aid, Relief, and Economic Security (CARES). In addition, the International Council of Shopping Centers is lobbying for aid specifically for retailers in malls and shopping centers. As Congress works on additional stimulus packages, including funding for the already exhausted Paycheck Protection Program, any aid for retailers could also lessen the short-term economic impact on mall REITs.
SPG Trades at A Historically Cheap Level
After falling 62% YTD, SPG now trades below its economic book value for the first time in the history of our model, per Figure 6. For long-term investors, SPG’s current price presents an opportunity to get an industry-leading business at a historically cheap level. At its current price of $56/share, SPG has a price-to-economic book value (PEBV) ratio of 0.5. This ratio means the market expects SPG’s NOPAT to permanently decline by 50%. This expectation seems overly pessimistic over the long-term. For reference, SPG’s NOPAT fell just 12% YoY in 2009 and, then, grew nearly 37% YoY in 2010, which put profits at an all-time high.
SPG’s current economic book value is $104/share – an 86% upside to the current price.
Figure 6: SPG’s Stock Price vs. Economic Book Value (EBV)
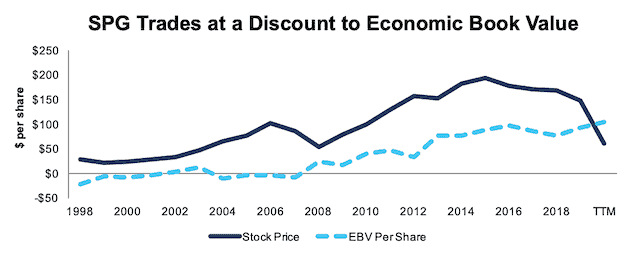
Sources: New Constructs, LLC and company filings.
SPG’s Price Already Implies Worst-Case Scenario
Below, we use our reverse DCF model to quantify the cash flow expectations baked into SPG’s current stock price. Then, we analyze the implied value of the stock based on different assumptions about COVID-19’s impact on the economy and SPG’s future growth in cash flows.
Scenario 1: Using industry projections, SPG’s revenue breakdown, and its historical margins, we can model the worst-case scenario already implied by SPG’s current stock price. In this scenario, we assume the following:
- Margins fall to 57% (five-year average, vs. 59% in 2018 and 58% in 2019) after rising in seven of the past ten years
- Revenue falls 60% in 2020, as two-thirds of tenants fail to make lease payments, per Mizuho Securities’ analysis
- Revenue jumps 27% in 2021, as one-third of tenants catch up on overdue lease payments, per Mizuho Securities’ analysis
- Thereafter, revenue grows again at 4% a year, which equals SPG’s revenue CAGR over the past decade
In the scenario where SPG’s NOPAT declines 60% in 2020 and 1% compounded annually over the next 15 years, the stock is worth $56/share today – equal to the current stock price. See the math behind this reverse DCF scenario.
Figure 7 compares the stock’s implied future NOPAT decline to the firm’s historical NOPAT growth in this scenario. This worst-case scenario implies SPG’s NOPAT 15 years from now will be 12% below its 2019 NOPAT. In other words, this scenario implies that over a decade and a half after the COVID-19 pandemic, Simon Property Group’s profits will have only recovered to the same level achieved in 2014. In any scenario better than this one, SPG holds significant upside potential, as we’ll show below.
Figure 7: Current Valuation Implies Severe, Long-Term Decline in Profits: Scenario 1
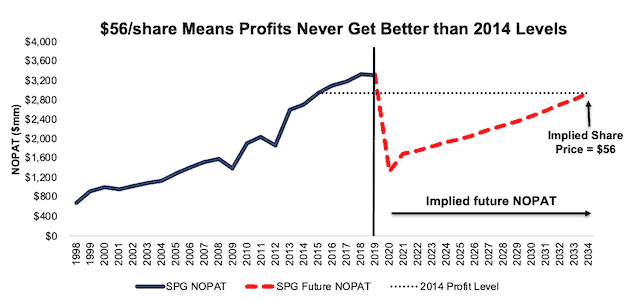
Sources: New Constructs, LLC and company filings.
Scenario 2: Cheap Valuation Provides Significant Upside
If we assume, as does ratings agency Fitch, that retailers begin reopening in mid-May, and that, according to the IMF, the pandemic threat is lessened in the second half of the year and through 2021, SPG looks even more undervalued.
In this scenario, we assume:
- Margins remain at 58% (equal to 2019)
- Revenue falls 25% in 2020, as tenants fail to make April, May, and June’s lease payments
- Sales growth returns in 2021 at 4% per year, which equals SPG’s revenue CAGR over the past decade
In this scenario, SPG’s NOPAT falls 25% in 2020 and grows by just 1% compounded annually over the next decade, and the stock is worth $106/share today – an 89% upside to the current price. See the math behind this reverse DCF scenario.
Figure 8 compares the stock’s implied future NOPAT to the firm’s historical NOPAT in scenario 2.
Figure 8: Implied Profits Assuming Global Recovery in 2021: Scenario 2
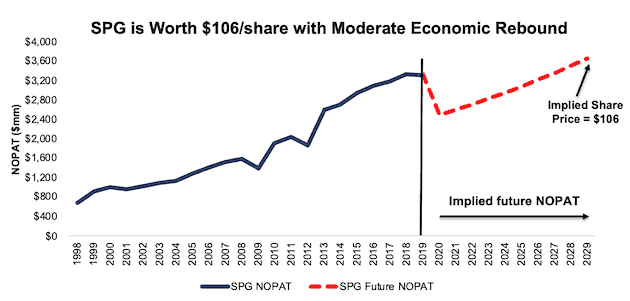
Sources: New Constructs, LLC and company filings.
Sustainable Competitive Advantages Will Drive Shareholder Value Creation
Here’s a summary of why we think the moat around SPG’s business will enable it to continue to generate higher NOPAT than the current market valuation implies. The following competitive advantages help SPG survive the downturn, and return to growth as the economy grows again:
- Strong portfolio of malls and shopping centers with superior sales per sq. foot growth and occupancy rates
- Ample liquidity to survive current downturn
- Strong management team - best-performing global CEOs by Harvard Business Review in 2013, 2014, 2016, 2017, and 2018
- Industry leading profitability
What Noise Traders Miss with SPG
These days, fewer investors focus on finding quality capital allocators with shareholder friendly corporate governance. Instead, due to the proliferation of noise traders, the focus is on short-term technical trading trends while high-quality fundamental research is overlooked. Here’s a quick summary of what noise traders are missing:
- Consistent core earnings growth and free cash flow generation over the past decade despite “retail apocalypse” narrative
- Staggered debt maturity dates minimize the impact one poor year has on the firm’s financial resources
- Valuation implies the economy never fully recovers from COVID-19
Executive Compensation Plan Could Be Improved
SPG executives are only eligible for annual bonuses if the firm meets a threshold FFO level. Once met, bonuses are then awarded based on individual goals for each executive. Some of the individual goals in 2019 included increasing leasing spreads per sq. foot, increasing short term revenues, completing a three-year tranche of senior notes, and more.
Executives long term bonuses are awarded based on meeting funds from operations, relative total shareholder return, and strategic objective performance goals. Performance of these goals is measured over a three-year period and award units vest one year after they’re earned.
We would prefer SPG should tie performance compensation to improvement in ROIC, as there is a strong correlation between improving ROIC and increasing shareholder value. Tying executive compensation to ROIC also ensures that executives’ interests are properly aligned with shareholders’ interests.
Despite using different metrics, SPG’s plan has not compensated executives while destroying shareholder value. SPG has grown economic earnings by 12% compounded annually since 2010.
Dividend Offers 15% Yield – But Could Be Cut to Conserve Liquidity
SPG has increased its dividend in each of the past ten years. From 2015-2019, SPG increased its dividend by 8% compounded annually. The current annualized dividend of $8.40/share gives SPG a current dividend yield of 15.0%. However, given the possibility that tenants stop paying rent, even for just a few months, it shouldn’t be a surprise if SPG cut its dividend to avoid liquidity issues.
We would expect any dividend cut to be temporary in nature and the new yield to still be higher than most stocks. For reference, SPG cuts its dividend to $0.60/share in mid-2009 and increased it to $0.80/share in late 2010.
Once cash flows from tenants return, SPG is in a good position to continue increasing its dividend. In the past five years, SPG has generated significantly more in free cash flow than they have paid out in dividends. SPG generated a cumulative FCF of $14.8 billion over the past five years and paid out $11.2 billion in dividends over the same time. Better yet, in each of the last four years, FCF exceeded dividend payments by an average of $979 million.
Firms with cash flows greater than dividend payments have a higher likelihood to maintain and grow dividends. While SPG may cut its dividend in the short term, investors buying at current price will still get a nice yield with upside potential as SPG returns to increasing its dividend over the long term.
In addition to dividends, SPG has returned capital to shareholders through share repurchases. The firm repurchased nearly $360 million worth of shares in 2019 and was authorized to repurchase up to $1.6 billion more through February 11, 2021. While SPG may choose not to repurchase shares and preserve cash, should they repurchase, it only increases an already impressive yield for investors.
A Consensus Beat or Signs of Recovery Could Send Shares Higher
According to Zacks, consensus estimates at the end of January pegged SPG’s 2020 FFO at $12.62/share. Jump forward to April 16, and consensus estimates for SPG’s 2020 FFO have fallen to just $11.69/share.
While the short-term impact of the COVID-19 pandemic is yet to be seen, these lowered expectations provide a great opportunity for a high-quality business, such as SPG, to beat consensus. Though our current Earnings Distortion Score for SPG is “In-Line”, SPG beat FFO estimates in nine of the past 12 quarters, and doing so again, in the midst of such market turmoil, could send shares higher.
Additionally, as a mall REIT, the most obvious concern over SPG in the short-term is the impact of store closures across the country. However, any positive signs regarding the lifting of restrictions in countries across the world, which could help provide a roadmap and clarity for the U.S. to lift restrictions, would be welcome news for shares.
Buying Quality Assets Strengthens SPG’s Portfolio
In early February, SPG agreed to acquire mall REIT peer Taubman Centers (TCO) for $3.6 billion in cash. The acquisition strengthens SPG’s already strong portfolio. In 2019, TCO’s U.S. shopping centers reported average sales per sq. foot of $972, or 40% higher than the average sales per sq. foot of SPG’s existing properties. Once the COVID-19 pandemic ends, SPG will have a more profitable portfolio across the country, which will help drive growth over the long term.
Insider Trading and Short Interest Trends
Over the past three months, insiders have purchased a total of 383 thousand shares and sold just 409 shares for a net effect of 383 thousand shares purchased. These purchases represent less than 1% of shares outstanding but indicate that insiders are adding to their positions as the stock price falls, rather than exiting.
There are currently 14.6 million shares sold short, which equates to 5% of shares outstanding and 3 days to cover. Short interest is down 9% from the prior month.
Critical Details Found in Financial Filings by Our Robo-Analyst Technology
As investors focus more on fundamental research, research automation technology is needed to analyze all the critical financial details in financial filings as shown in the Harvard Business School and MIT Sloan paper, "Core Earnings: New Data and Evidence”.
Below are specifics on the adjustments we make based on Robo-Analyst findings in Simon Property Group’s 2019 10-K:
Income Statement: we made $1.3 billion of adjustments with a net effect of removing $1.2 billion in non-operating expenses (21% of revenue). See all adjustments made to SPG’s income statement here.
Balance Sheet: we made $2.0 billion of adjustments to calculate invested capital with a net increase of $78 million. One of the most notable adjustments was $515 million (2% of reported net assets) in operating leases. See all adjustments to SPG’s balance sheet here.
Valuation: we made $25.6 billion of adjustments with a net effect of decreasing shareholder value by $23.7 billion. Apart from total debt, the most notable adjustment to shareholder value was $604 million in minority interests. This adjustment represents 4% of SPG’s market cap. See all adjustments to SPG’s valuation here.
Attractive Funds That Hold SPG
The following funds receive our Attractive rating and allocate significantly to Simon Property Group.
- FundVantage Quality Dividend Fund (QDVCX) – 3.4% allocation.
- Hillman Capital Management Value Fund (HCMAX) – 3.1% allocation.
- Transamerica Dividend Focused Fund (TADFX) – 2.9% allocation.
- Invesco S&P 500 High Dividend Low Volatility ETF (SPHD) – 2.5% allocation.
- Asset Management Large Cap Equity Fund (IICAX) – 2.1% allocation.
This article originally published on April 20, 2020.
Disclosure: David Trainer, Kyle Guske II, and Matt Shuler receive no compensation to write about any specific stock, style, or theme.
Follow us on Twitter, Facebook, LinkedIn, and StockTwits for real-time alerts on all our research.
[1] Our core earnings are a superior measure of profits, as demonstrated in In Core Earnings: New Data & Evidence a paper by professors at Harvard Business School (HBS) & MIT Sloan. The paper empirically shows that our data is superior to IBES “Street Earnings”, owned by Blackstone (BX) and Thomson Reuters (TRI), and “Income Before Special Items” from Compustat, owned by S&P Global (SPGI).