
We closed this position on April 5, 2018. A copy of the associated Position Update report is here.
Check out this week’s Danger Zone interview with Chuck Jaffe of Money Life and Marketwatch.com
Since the presidential election, the S&P 500 is up 5%, the Dow is up 7%, and the Nasdaq is up 4%. This week’s Danger Zone is up 43% on the shoulders of the “Trump Rally,” but the economics of this business cannot justify this stock’s valuation. With a weak competitive position, a history of shareholder value destruction, and a significantly overvalued stock price, Tutor Perini (TPC: $28/share) is in the Danger Zone this week.
Revenue Growth Does Not Equal Profit Growth
Tutor Perini’s economic earnings, the true cash flows of the business, have declined from -$66 million in 2010 to -$170 million over the last twelve months (TTM). This deterioration in the economics of the business comes despite revenue growing 9% compounded annually during the same period, per Figure 1. Investors must look past top line growth to find the true economic reality of the business. See a reconciliation of Tutor Perini’s GAAP net income to economic earnings here.
Figure 1: Tutor Perini’s Negative Economic Earnings
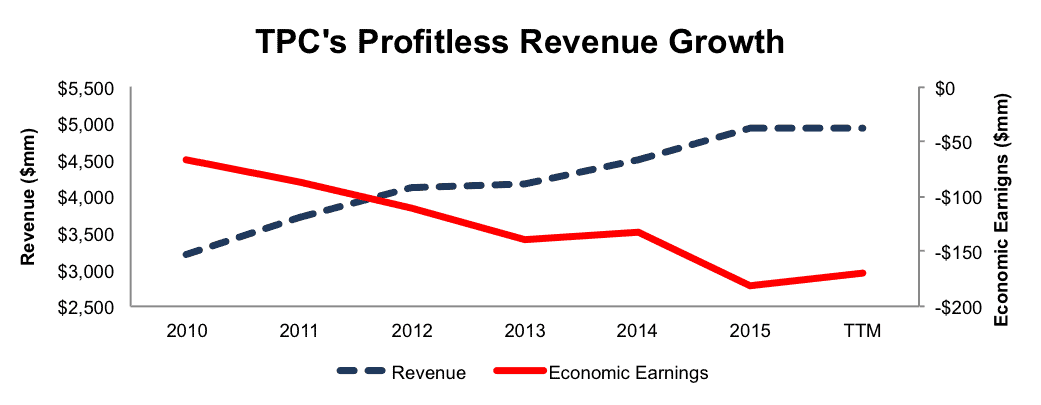 Sources: New Constructs, LLC and company filings
The issues do not end with declining economic earnings. Tutor Perini’s NOPAT margin has halved, from 4% in 2010 to 2% TTM while the company has burned through cumulative $1.1 billion in free cash flow (FCF) over the past five years. Across multiple key metrics, Tutor Perini’s business is showing significant signs of deterioration.
Questionable Acquisitions Cannot Be Ignored
Acquisitions are continually touted by management as “earnings accretive” or “shareholder friendly.” On the surface, most acquisitions would appear to be accretive, due to the high low fallacy. All too often, more rigorous research reveals acquisitions to be poor allocations of capital and harmful to the economics of the acquiring firm which is the case with Tutor Perini.
In 2008, Perini Corp (CEO Ron Tutor) merged with Tutor Saliba (96% owned by Ron Tutor) in an all stock deal. This deal, clearly a major conflict of interest and questionable corporate governance for Mr. Tutor, resulted in a big payday for execs (Mr. Tutor received Perini stock worth over $500 million), but destroyed value for existing shareholders. Per Figure 2, TPC’s return on invested capital (ROIC) was an impressive 24% in 2007 but after the merger, fell to 8% in 2009.
Two years later, Tutor Perini acquired seven separate companies in 2010/2011 with a cost of over $644 million. Unfortunately, these acquisitions did little to earn a quality return on invested capital, as the company’s ROIC continued its downward trend, and currently sits at a bottom-quintile 3%. Management must be held accountable for its capital allocation decisions. Per Figure 2, it’s clear Tutor Perini’s acquisitions have not been as accretive as the company reported at time of purchase.
Figure 2: Tutor Perini’s Capital Destruction
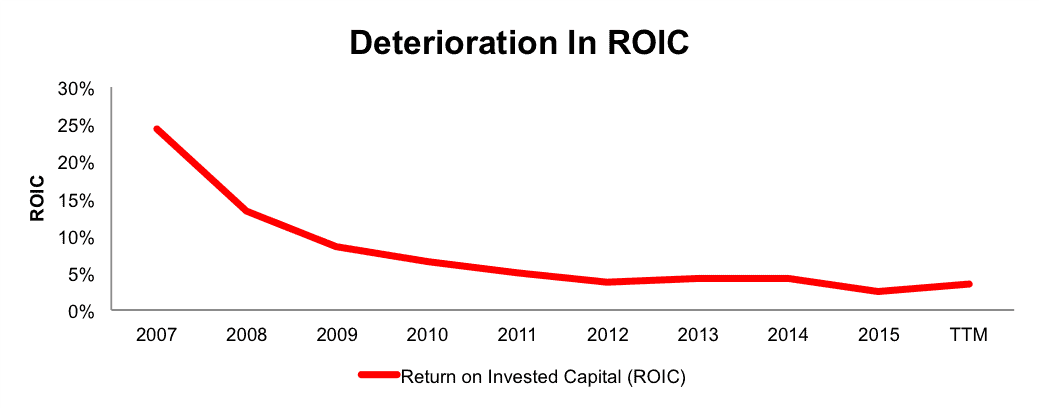
Sources: New Constructs, LLC and company filings
Compensation Plan Fuels Shareholder Value Destruction
Misaligned executive compensation plans can line the pockets of executives while costing shareholders big time. Tutor Perini’s executive compensation plan is heavily weighted towards incentive pay, which includes long-term equity awards and annual incentive bonuses. When combined, incentive pay makes up 83% of the CEO’s pay and 67% of other executives’ pay. However, in each case, the metrics used to award incentive pay do not align executive interests with those of shareholders – despite what Tutor Perini’s compensation committee claims in its proxy statement.
Annual incentive bonuses and long-term equity awards are paid out upon the achievement of pre-tax income, which, according to Tutor Perini’s compensation committee “best aligns with the goal of shareholder value creation.” As we’ve demonstrated through multiple case studies, ROIC, not pre-tax income, is the primary driver of shareholder value creation. As shown above, Tutor Perini’s pre-tax income goal has not led to shareholder value creation, but rather destroyed value for nearly a decade. Without changes to this plan, preferably to emphasize ROIC, investors should expect further value while management continues to get big payouts.
Non-GAAP Metrics Distort Economic Reality
Non-GAAP metrics are a red flag for investors because of the discretion management gets when calculating them. Tutor Perini uses non-GAAP metrics when it suits them, ignoring them in some years and using them in others. This use of non-GAAP not only masks the deterioration of the economics of the business, but also their inconsistent use makes year-over-year comparisons more difficult. The metrics TPC has used include, adjusted operating income, adjusted net income, and adjusted EPS, each of which management claims “enhances an overall understanding of our historical financial performance and future prospects.” Below are some of the expenses TPC removes to calculate these non-GAAP metrics:
- Impairment charge
- Litigation-related charge
- Litigation provision
- Loss on sale of investments
These adjustments have a significant impact on the disparity between GAAP net income, non-GAAP net income, and economic earnings. In 2015, TPC removed nearly $14 million in litigation-related charges (30% of 2015 GAAP net income) to calculate adjusted net income. This adjustment allowed Tutor Perini to report adjusted net income of $59 million, compared to only $45 million GAAP net income, and -$170 million economic earnings, per Figure 3.
Figure 3: Disconnect Between Non-GAAP & Economic Earnings

Sources: New Constructs, LLC and company filings
Diminished Profitability In An Already Low Margin Industry
Tutor Perini specializes in large construction projects that include highways, wastewater facilities, casinos, office buildings, and airports. While such large projects require significant resources and building knowledge, TPC still faces competition from numerous private and public firms. Competitors include Flatiron Construction Corp, Fluor Corp (FLR) Granite Construction (GVA), Traylor Bros, AECOM Technology (ACM), Suffolk Construction, and Sterling Construction (STRL). While this list is non-exhaustive, per Figure 4 below, it’s clear that Tutor Perini has profitability issues within its own industry.
Note that the firm with the highest NOPAT margin still manages just a 6% margin, which means Tutor Perini’s 2% margin is at a competitive disadvantage in an already low margin industry. Similarly, its 3% ROIC ranks equal to or below all competitors listed in Figure 4. With lagging margins and ROIC, more profitable firms can bid for jobs at prices where TPC cannot operate profitability. This competitive disadvantage leaves TPC bidding on less attractive deals or accepting losses upfront with hopes of increasing efficiency before the project is completed.
Figure 4: Tutor Perini’s Low Profitability
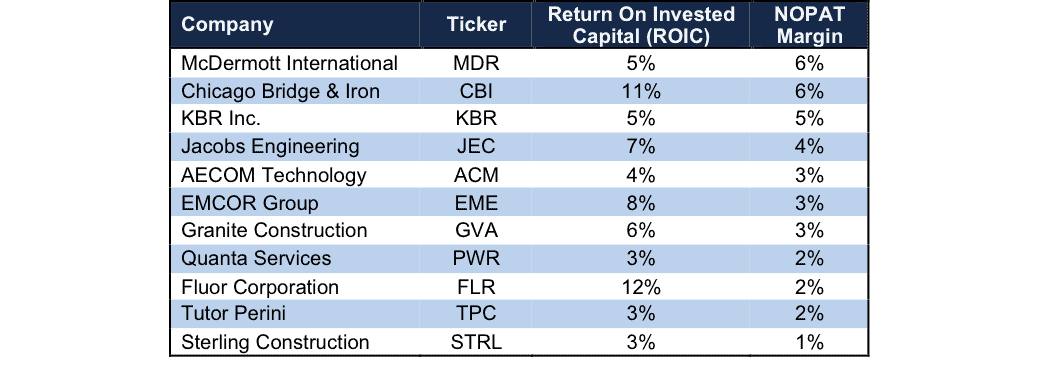
Sources: New Constructs, LLC and company filings
Bull Hopes Rest On Backlog Dreams
For many companies involved in construction or manufacturing, management teams point to backlog as a measure of the health of the business. The idea being that the higher the backlog, the greater profit potential of the firm, since backlog represents the value of work yet to be performed. However, as with many metrics, backlog does little to measure the profits generated, yet it remains a strong “reason” for investment in TPC.
As we show below, TPC has effectively grown its backlog, all while cash flows have declined. Per Figure 5, TPC’s backlog has grown from $4.1 billion in 2012 to $6.7 billion in 3Q16, or 13% compounded annually. Meanwhile, economic earnings have declined from -$111 million 2012 to -$170 TTM, or -8% compounded annually. Given its history, there is little evidence to believe TPC is capable of turning its backlog into profitable business operations.
Figure 5: Backlog Fails To Generate Profits

Sources: New Constructs, LLC and company filings.
Along the lines of the backlog, bulls will also point to president-elect Donald Trump’s plans to increase infrastructure spending as reason to buy into TPC. This argument falls by the wayside in a similar manner as the backlog argument.
TPC has proven its inability to contract deals in a profitable manner (see Figure 1) so increased infrastructure spending does not ensure profits by any means. In fact, given the firm’s low profitability mentioned earlier, TPC cannot always compete for deals and may be left fighting for less profitable contracts. Either way, an increase in projects has done little to grow the profits of the business in the past, and we see no reason to believe it will do so in the future. Up to this point, TPC has given little reason to believe it can turn around years of shareholder value destruction.
Compounding the issues, any bull case fails to explain the firms increased valuation in wake of the presidential election. As we’ll detail below, the stock’s valuation not only implies a boost due to infrastructure spending, but also that TPC can take significant market share moving forward.
Upside In TPC Is Already Priced In
Despite no change in business fundamentals, TPC is up 70% year-to-date as investors have clamored for any and all construction stocks since Donald Trump won the presidential election. We’ve covered this topic in depth in our report “4 Stocks To Buy Now No Matter Who Wins The Presidency.” Unfortunately, TPC did not make this list, and, assuming all construction firms are worthy of investment based on the promise of increased infrastructure spending is a recipe for disaster. As such, the significant price increase this year without a subsequent improvement in the business’s cash flow leaves TPC priced beyond perfection.
To justify its current price of $28/share, TPC must maintain 2015 NOPAT margins of 2% and grow NOPAT by 12% compounded annually for the next 11 years. In this scenario, Tutor Perini would be generating over $14 billion in revenue (11 years from now), which is greater than Chicago Bridge & Iron’s fiscal 2015 revenue and equal to the combined revenue of Quanta Services and EMCOR Group in fiscal 2015. In other words, the expectations baked into the stock price imply TPC taking significant market share moving forward.
Even if we assume TPC can maintain 2% margins and grow NOPAT by 9% compounded annually for the next decade, the stock is only worth $15/share today – a 46% downside. Each of these scenarios also assumes TPC is able to grow revenue and NOPAT/free cash flow without spending on working capital or fixed assets. This assumption is unlikely but allows us to create very optimistic scenarios that demonstrate how high expectations in the current valuation are. For reference, TPC’s invested capital has grown on average $324 million (7% of 2015 revenue) per year over the last five years.
Is TPC Worth Acquiring?
The largest risk to our bear thesis is what we call “stupid money risk”, which means an acquirer comes in and pays for TPC at the current, or higher, share price despite the stock being significantly overvalued. Accordingly, we only see an acquisition as possible if an acquiring firm is willing to destroy substantial shareholder value.
Below we show just how expensive TPC remains after assuming an acquirer can gain significant synergies.
To begin, TPC has liabilities of which investors may not be aware that make it more expensive than the accounting numbers suggest.
- $258 million in deferred tax liabilities (18% of market cap)
- $90 million in off-balance-sheet operating leases (6% of market cap)
- $34 million in underfunded pensions (2% of market cap)
- $16 million in outstanding employee stock options (1% of market cap)
After adjusting for these liabilities (which represent 27% of TPC’s market cap) we can model multiple purchase price scenarios. Even in the most optimistic of scenarios, TPC is worth less than the current share price.
Figures 6 and 7 show what we think Chicago Bridge & Iron (CBI) should pay for Tutor Perini to ensure it does not destroy shareholder value. CBI has not been shy about large acquisitions in the past ( $3.4 billion for Shaw Group in 2013), and adding Tutor Perini could diversify CBI beyond its traditional energy market while capitalizing on other business lines such as wastewater facilities. However, there are limits on how much CBI would pay for TPC to earn a proper return, given the NOPAT of free cash flows being acquired.
Each implied price is based on a ‘goal ROIC’ assuming different levels of revenue growth. In each scenario, the estimated revenue growth rate in year one and two equals the consensus estimate for 2016 (5%) and 2017 (7%). For the subsequent years, we use 7% in scenario one because it represents a continuation of 2017 expectations. We use 10% in scenario two because it assumes a merger with CBI could create revenue growth through crossover projects within industries.
We conservatively assume that Chicago Bridge & Iron can grow TPC’s revenue and NOPAT without spending on working capital or fixed assets. We also assume TPC immediately achieves a 3% NOPAT margin, which is greater than the average of the past five years. For reference, Tutor Perini’s TTM NOPAT margin is 2%, so this assumption implies immediate improvement and allows the creation of a truly best case scenario.
Figure 6: Implied Acquisition Prices For CBI To Achieve 9% ROIC

Sources: New Constructs, LLC and company filings.
Figure 6 shows the ‘goal ROIC’ for CBI as its weighted average cost of capital (WACC) or 9%. Even if Tutor Perini can grow revenue by 9% compounded annually with a 3% NOPAT margin for the next five years, the firm is worth less than its current price of $28/share. It’s worth noting that any deal that only achieves a 9% ROIC would be only value neutral and not accretive, as the return on the deal would equal CBI’s WACC.
Figure 7: Implied Acquisition Prices For CBI To Achieve 11% ROIC

Sources: New Constructs, LLC and company filings.
Figure 7 shows the next ‘goal ROIC’ of 11%, which is CBI’s current ROIC. Acquisitions completed at these prices would be truly accretive to CBI shareholders. Even in the best-case growth scenario, the most CBI should pay for TPC is $17/share (42% downside). Even assuming this best-case scenario, CBI would destroy just over $1.7 billion by purchasing TPC at its current valuation. Any scenario assuming less than 9% CAGR in revenue would result in further capital destruction for CBI.
“Trump Rally” Won’t Last Forever: Fundamentals Matter
As noted earlier, the “Trump Rally” has been quite good to TPC, which is up 43% since the election. This price action, without any improvement in the business leaves investors stuck in a precarious situation. On one hand, investors could believe the new momentum and promised infrastructure spending will lead to higher share prices in the future. On the flip side, TPC must now perform above and beyond the prior expectations simply to justify the current share price.
Essentially, with the huge rally, TPC is left in a “show me” state, where investors will be expecting outstanding results to justify the new valuation. We already know how momentum stocks can see their valuations tank when poor fundamentals are brought to light and TPC is no different. Once the euphoria and technical drivers subside, all that remains are the business’ economics, which as noted above, do not warrant the current valuation. One quarter of “missed earnings” could be all it takes to bring TPC back to a more rational valuation.
Adding to the downside pressure, noted short seller, Carson Block, recently announced TPC as his latest short trade. While this announcement may have been overlooked, as it came one month before the election, it could provide the catalyst that sends shares lower. Specifically, Mr. Block questioned TPC’s projected earnings growth, its inability to generate cash flow, and whether its access to capital will be shut off by banks. Any one of the three issues could certainly stop TPC in its tracks and cause shares to fall.
Insider Action Is Minimal While Short Interest Is Noteworthy
Over the past 12 months, 64 thousand insider shares have been purchased and 48 thousand have been sold for a net effect of 16 thousand insider shares purchased. These sales represent less than 1% of shares outstanding. Additionally, there are 4.4 million shares sold short, or just under 9% of shares outstanding.
Impact of Footnotes Adjustments and Forensic Accounting
In order to derive the true recurring cash flows, an accurate invested capital, and a real shareholder value, we made the following adjustments to TPC’s 2015 10-K:
Income Statement: we made $123 million of adjustments with a net effect of removing $34 million in non-operating expense (<1% of revenue). We removed $45 million related to non-operating income and $78 million related to non-operating expenses. See all the adjustments made to TPC’s income statement here.
Balance Sheet: we made $1 billion of adjustments to calculate invested capital with a net increase of $758 million. The most notable adjustment was $643 million (25% of reported net assets) related to asset write-downs. See all adjustments to TPC’s balance sheet here.
Valuation: we made $1.2 billion of adjustments with a net effect of decreasing shareholder value by $1.2 billion. There were no adjustments that increased shareholder value. Apart from total debt, which includes $90 million in off-balance-sheet operating leases, the most notable adjustment was $258 million related to deferred tax liabilities. This adjustment represents 19% of TPC’s market cap.
Dangerous Funds That Hold TPC
The following funds receive our Dangerous-or-worse rating and allocate significantly to Tutor Perini.
- Towle Deep Value Fund (TDVFX) – 4.3% allocation and Very Dangerous rating.
- CWC Small Cap Aggressive Value Fund (CWCIX) – 3.1% allocation and Very Dangerous rating.
- Hotchkis & Wiley Small Cap Value Fund (HWSAX) – 2.9% allocation and Very Dangerous rating.
- ClearBridge Small Cap Value Fund (SBVAX) – 2.2% allocation and Very Dangerous rating.
This article originally published here on December 12, 2016.
Disclosure: David Trainer, Kyle Guske II, and Kyle Martone receive no compensation to write about any specific stock, style, or theme.
Scottrade clients get a Free Gold Membership ($588/yr value) as well as 50% discounts and up to 20 free trades ($140 value) for signing up to Platinum, Pro or Unlimited memberships. Login or open your Scottrade account & find us under Quotes & Research/Investor Tools.