
The earnings recession is worse than it looks on the surface. While GAAP earnings are down 1% over the trailing twelve months (TTM), core earnings are down 6%. The difference is Earnings Distortion, which just hit levels not seen since the last two market crashes. However, as is always the case, investors should not throw the baby out with the bathwater. There are sectors that are more profitable than they appear because earnings distortion is much lower or negative.
The Consumer Non-cyclicals sector has the least earnings distortion. In fact, earnings distortion levels are negative – meaning core earnings are higher than GAAP net income. It also earns an Attractive rating according to our sector rating methodology. The Consumer Non-cyclicals sector – and specifically General Mills (GIS: $53/share) – is this week’s Long Idea.
Earnings Distortion Varies by Sector
Figure 1 ranks all 11 sectors by earnings distortion as a percentage of total assets[1] – which professors from HBS and MIT Sloan used in a long/short strategy that generated 10% in abnormal returns. Seven of the eleven sectors have negative earnings distortion, i.e. understated earnings. However, the three sectors that make up the largest portion of the market – Financials, Consumer Cyclicals, and Technology – all have positive earnings distortion, or overstated earnings.
Figure 1: Earnings Distortion Rankings by Sector as of December 3, 2019
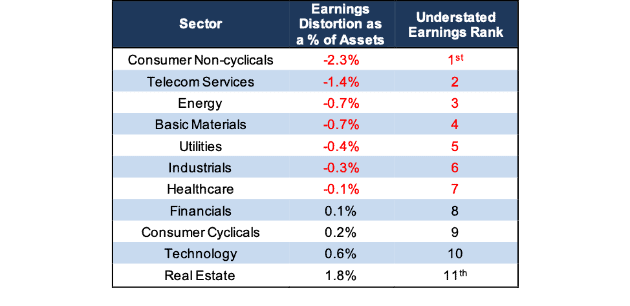
Sources: New Constructs, LLC and company filings.
The takeaway is that while the largest, high-profile sectors have hidden risks, there are opportunities to be found in some of the less-hyped, more defensive areas of the market.
In particular, the Consumer Non-cyclicals sector, with -2.3% earnings distortion as a % of assets, stands out as having the most understated earnings.
Understated Earnings in Consumer Non-cyclicals
Investors who look at GAAP earnings would think the Consumer Non-cyclicals sector is in a crisis. Average GAAP earnings for the 128 companies we covered in the sector fell from $870 million per company in 2017 to $729 million per company in 2018, a 16% decline. Average GAAP earnings per company declined another 29%, down to $516 million, between 2018 and the trailing twelve months (TTM) period. On the other hand, average core earnings were up 2% between 2017 and 2018, and down just 5% from 2018 to TTM.
Figure 2: Consumer Non-cyclicals Average Core Earnings vs. GAAP: 1998-TTM
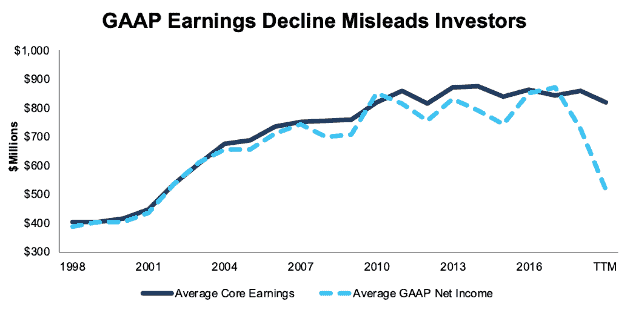
Sources: New Constructs, LLC and company filings
Asset write-downs are the main driver of earnings distortion in the Consumer Non-cyclicals sector. Kraft Heinz (KHC) famously took a $16 billion write-down earlier this year that accounts for nearly a third of the earnings distortion in the sector overall.
As we wrote when we put Mondelez (MDLZ) in the Danger Zone in April 2019, many large companies in the Consumer Non-cyclicals sector have a declining competitive advantage due to the rise of e-commerce and shifting consumer tastes. There are real challenges facing companies in this sector, which is why KHC and others have taken significant write-downs.
Still, these write-downs may be leading some to believe that the profits in this sector are falling off a cliff, when in reality they are still fairly stable. Don’t let the headlines trick you into painting the entire sector with the same brush.
Understanding Earnings Distortion Is Essential Diligence
Figure 3 shows that the increasingly negative earnings distortion for the Consumer Non-cyclicals sector is part of a longer trend. From 1998-2007, average earnings distortion stayed near zero, while over the past decade the difference between GAAP net income and core earnings has increased significantly. This trend aligns with the findings of the HBS and MIT Sloan paper “Core Earnings: New Data & Evidence”, which shows that the average number of income statement adjustments per company is rising significantly. Financial filings are becoming more complicated, and GAAP earnings are becoming a less reliable measure of profitability.
Figure 3: Consumer Non-cyclicals Average Earnings Distortion: 1998-TTM
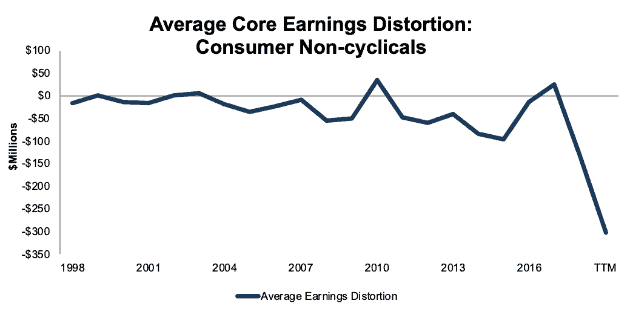
Sources: New Constructs, LLC and company filings
It’s more important than ever for investors to get high-quality research that analyzes more than income statements and press releases, which managers often dress up to appease investors in the short term.
Earnings Distortion Research Reveals a Hidden Gem
General Mills (GIS) has some of the most understated earnings in the Consumer Non-cyclicals sector and earns our Attractive rating. GIS’s TTM earnings are understated primarily due to three large non-recurring expenses:
- $275 million in restructuring charges
- $53 million in fair value adjustments to inventory in conjunction with its acquisition of Blue Buffalo
- $25 million in acquisition integration costs
Combined, these charges add up to $353 million (2% of revenue). In addition, the company’s 2018 earnings were overstated due to a $524 million (3% of revenue) benefit from tax reform.
As a result, GIS’s GAAP earnings per share declined 15% from 2018 to the trailing twelve months (TTM) period. Meanwhile, core earnings per share increased by 10% over the same time.
Further, the stock looks undervalued compared to the rest of the market. At its current valuation of $53/share, GIS has a price to economic book value (PEBV) of 0.8. This ratio means the market expects after-tax operating profit (NOPAT) to permanently decline by 20%. This expectation seems pessimistic for a company that has grown NOPAT by 4% compounded annually over the past decade.
If GIS can maintain its 2019 NOPAT margin of 13% and grow NOPAT by just 4% compounded annually over the next decade, the stock is worth $100/share today, an 88% upside to the current stock price. See the math behind this dynamic DCF scenario.
The market seems to be valuing GIS based on its declining GAAP earnings, but diligence shows that core earnings are continuing a long-term trend of steady growth.
Analyzing Earnings Distortion Across the Rest of the Market
Figures 4-23 show average core earnings vs. GAAP and average core earnings distortion for the other 10 sectors.
Basic Materials
Figure 4 shows average core earnings grew by 24% compounded annually from 2015 to 2018, driven by rising commodity prices. From 2018 to TTM, core earnings declined by 21%
Figure 4: Basic Materials Average Core Earnings vs. GAAP: 1998-TTM
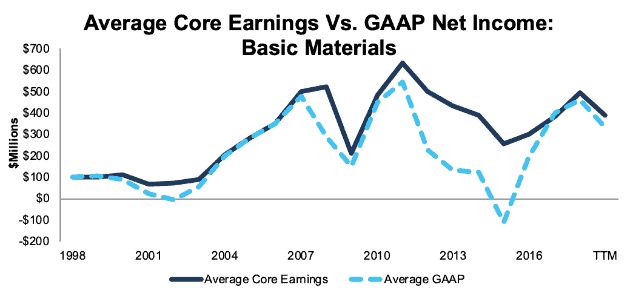
Sources: New Constructs, LLC and company filings
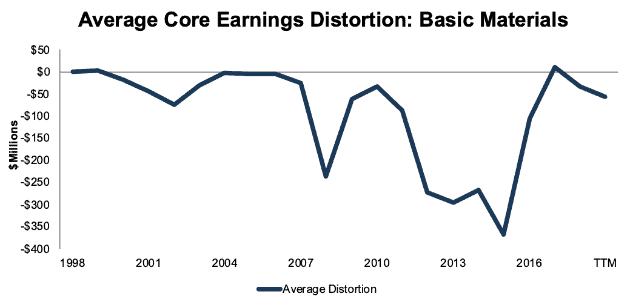
Figure 5 shows earnings distortion for the sector has remained relatively low for most of the past 20 years. The only exception is from 2012-2015 when volatility in commodity prices drove significant write-downs. TTM GAAP earnings understate core earnings by an average of $56 million, or 14%, for the 146 companies in the sector we currently cover.
Figure 5: Basic Materials Average Core Earnings Distortion: 1998-TTM
Sources: New Constructs, LLC and company filings
Consumer Cyclicals
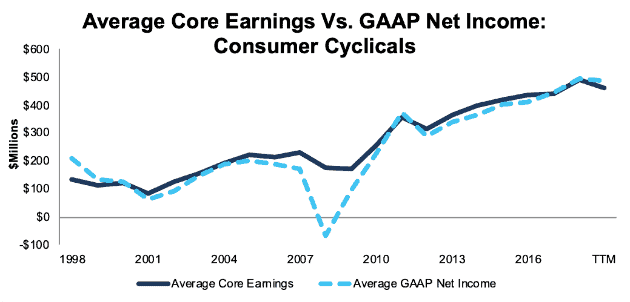
TTM core earnings are down for the Consumer Cyclicals sector after six consecutive years of growth from 2012-2018. Average core earnings declined 6% from 2018 to TTM, while GAAP net income is down just 2%.
Figure 6: Consumer Cyclicals Average Core Earnings vs. GAAP: 1998-TTM
Sources: New Constructs, LLC and company filings
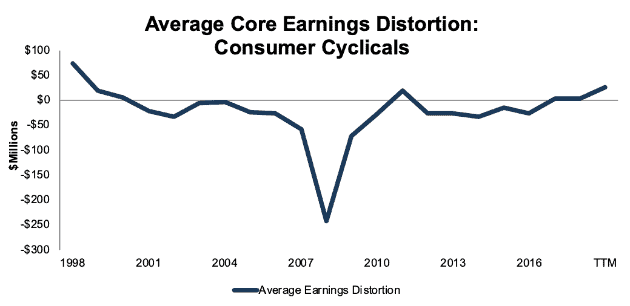
At $24 million over the TTM, the average earnings distortion is the highest in the sector since 1998. Non-recurring gains are masking some of the real challenges Consumer Cyclicals firms face.
Figure 7: Consumer Cyclicals Average Core Earnings Distortion: 1998-TTM
Sources: New Constructs, LLC and company filings
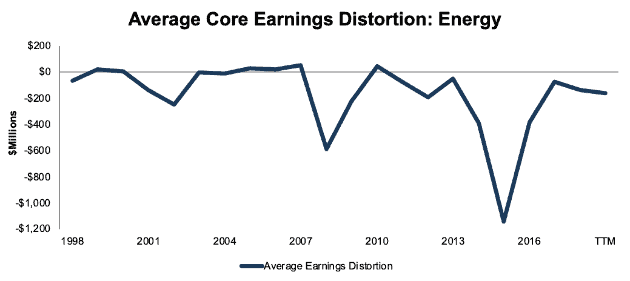
Energy
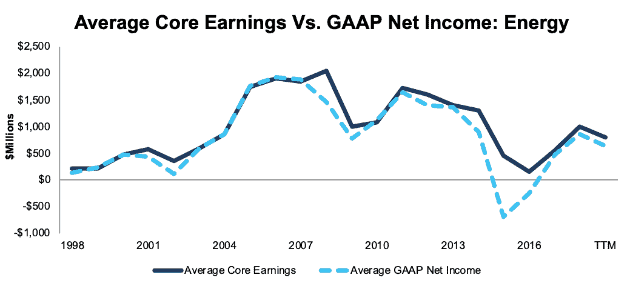
Similar to the Basic Materials sector, core earnings in the Energy sector rebounded from 2016-2018 due to rising commodity prices, but declined by 21% from 2018-TTM.
Figure 8: Energy Average Core Earnings vs. GAAP: 1998-TTM
Sources: New Constructs, LLC and company filings
Aside from a couple of big troughs during commodity crashes in 2008 and 2015, GAAP earnings have been relatively accurate (minimal earnings distortion) in the Energy sector. The TTM trend in GAAP net income (down 27% since 2018) looks slightly worse than core earnings (down 21% since 2018).
Figure 9: Energy Average Core Earnings Distortion: 1998-TTM
Sources: New Constructs, LLC and company filings
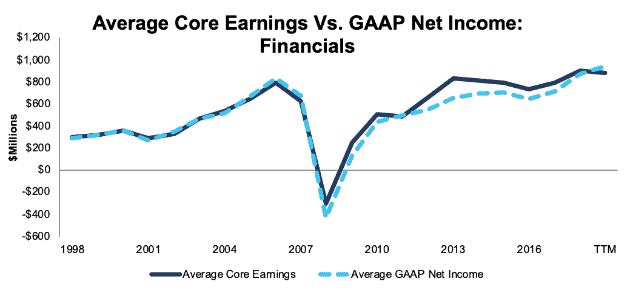
Financials
Average core earnings are down 2% in the Financials sector from 2018-TTM, while GAAP earnings are up 8%. Investors who rely on GAAP likely think profits are better than they really are.
Figure 10: Financials Average Core Earnings vs. GAAP: 1998-TTM
Sources: New Constructs, LLC and company filings
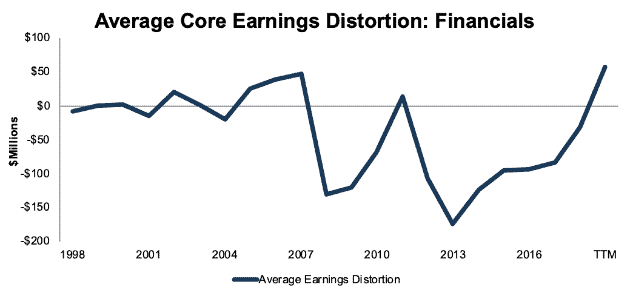
One reason for the spike in earnings distortion over the TTM period is the recent adoption of the accounting standard ASU 2016-01. The rule, which went into effect in 2018, requires unrealized gains and losses on securities to be recognized directly on the income statement, rather than waiting until the securities are sold. Due to this rule, Berkshire Hathaway (BRK.A) has nearly $40 billion in unrealized investment gains artificially increasing its net income through the first nine months of 2019.
Figure 11: Financials Average Core Earnings Distortion: 1998-TTM
Sources: New Constructs, LLC and company filings
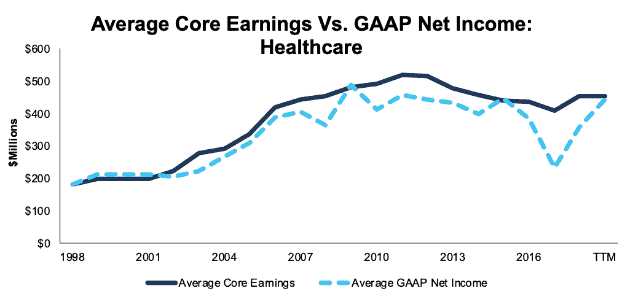
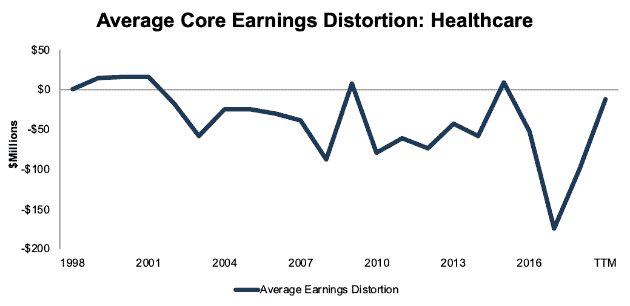
Healthcare
TTM core earnings and GAAP net income are nearly identical in the Healthcare sector, but the trend in these two metrics is very different. Average core earnings are flat from 2018-TTM, while average GAAP earnings are up 24%.
Figure 12: Healthcare Average Core Earnings vs. GAAP: 1998-TTM
Sources: New Constructs, LLC and company filings
Earnings distortion was highly negative for the sector in 2017-2018, due in part to the impact of tax reform. Johnson and Johnson (JNJ), for example, had a $10 billion non-recurring tax charge in 2017 and a $1.6 billion charge in 2018. Now that these unusual charges from tax reform are nearly done, earnings distortion is back close to 0.
Figure 13: Healthcare Average Core Earnings Distortion: 1998-TTM
Sources: New Constructs, LLC and company filings
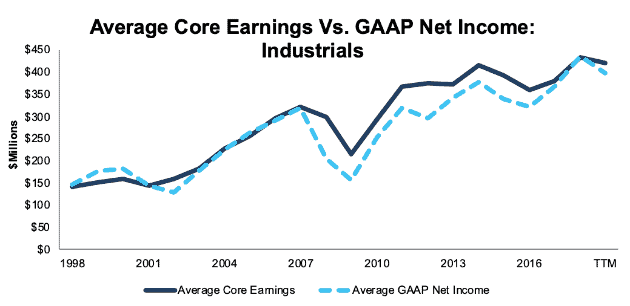
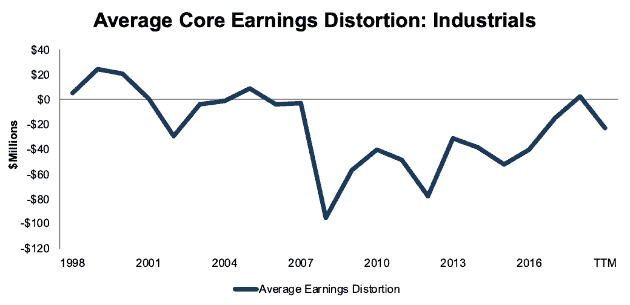
Industrials
GAAP net income overstates the magnitude of the decline for companies in the Industrials sector. Average GAAP earnings are down 9% from 2018-TTM, while core earnings are down just 3%.
Figure 14: Industrials Average Core Earnings vs. GAAP: 1998-TTM
Sources: New Constructs, LLC and company filings
While earnings for the sector as a whole are understated, there are still companies with overstated earnings that investors should avoid. We recently highlighted Northrop Grumman (NOC) as a stock investors should avoid due to its overstated earnings from non-operating pension gains.
Figure 15: Industrials Average Core Earnings Distortion: 1998-TTM
Sources: New Constructs, LLC and company filings
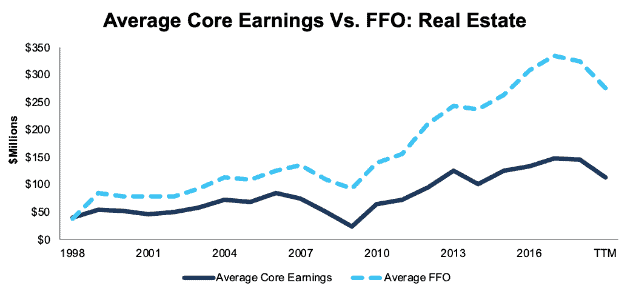
Real Estate
Average core earnings declined by 23% between 2018-TTM for the Real Estate sector, while funds from operations (FFO) – the preferred metric used by REIT investors – declined by 15%.
Figure 16: Real Estate Average Core Earnings vs. FFO: 1998-TTM
Sources: New Constructs, LLC and company filings
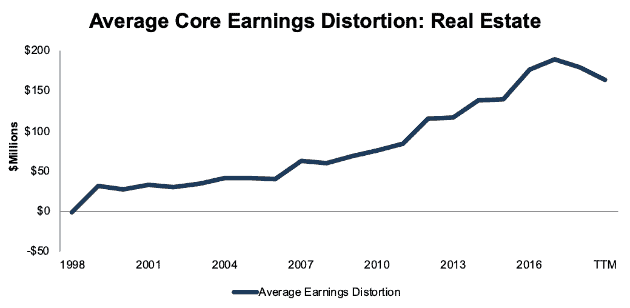
Earnings distortion in the Real Estate sector steadily increased from 1998-2017. The level of earnings distortion declined slightly in 2018 and TTM, but earnings distortion remains higher in the Real Estate sector than in any other sector of the market.
Figure 17: Real Estate Average Core Earnings Distortion: 1998-TTM
Sources: New Constructs, LLC and company filings
Technology
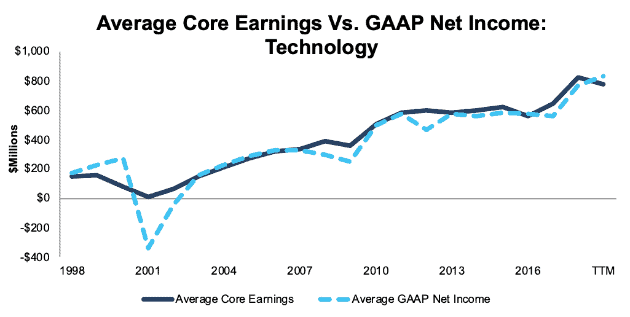
Core earnings and GAAP net income tell completely different stories over the TTM period of the Technology sector. Average core earnings declined 6%, while GAAP earnings are up 9%. The 40% gain for the Technology Select Sector SPDR Fund (XLK) in 2019 suggests that, right now, misleading GAAP earnings may be fooling investors.
Figure 18: Technology Average Core Earnings vs. GAAP: 1998-TTM
Sources: New Constructs, LLC and company filings
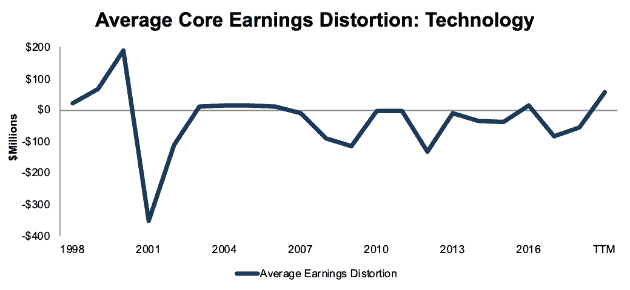
Figure 19 shows average earnings distortion in the tech sector is at its highest point since 2000, the peak of the tech bubble. Technology investors could be in for a rude awakening when managers run out of earnings distortion tricks and GAAP net income follows core earnings down.
Figure 19: Technology Average Core Earnings Distortion: 1998-TTM
Sources: New Constructs, LLC and company filings
Telecom
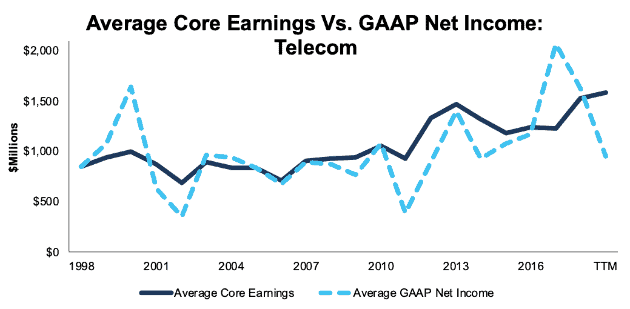
Average core earnings are up 4% between 2018-TTM for the Telecom sector. As we noted previously, the Telecom sector is the only sector with a rising ROIC.
Figure 20: Telecom Average Core Earnings vs. GAAP: 1998-TTM
Sources: New Constructs, LLC and company filings
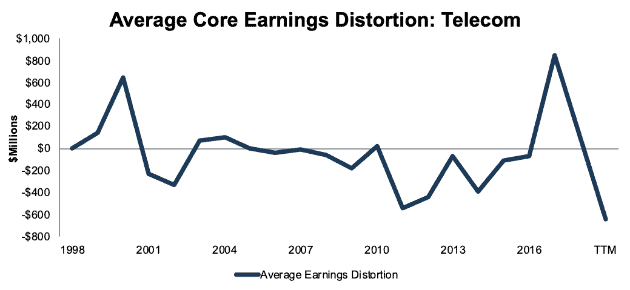
Despite the solid core earnings growth in the sector, average TTM GAAP earnings are down sharply, which leads to significant value opportunities for diligent investors. We recently made Verizon (VZ) a Long Idea due in part to its understated earnings from non-recurring restructuring and write-down charges.
Figure 21: Telecom Average Core Earnings Distortion: 1998-TTM
Sources: New Constructs, LLC and company filings
Utilities
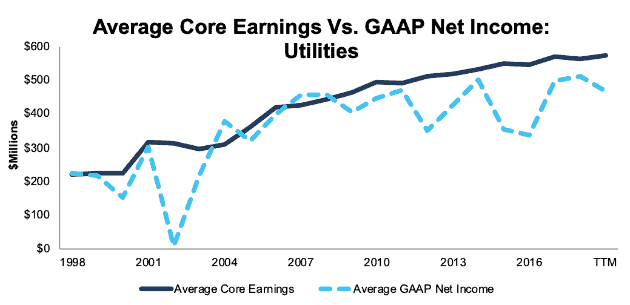
Utilities also have rising core earnings and declining GAAP net income. Average core earnings are up 2% from 2018-TTM, while average GAAP earnings declined by 8%. Despite the core earnings growth, we still have an Unattractive rating on the sector due to its low ROIC and negative free cash flow.
Figure 22: Utilities Average Core Earnings vs. GAAP: 1998-TTM
Sources: New Constructs, LLC and company filings
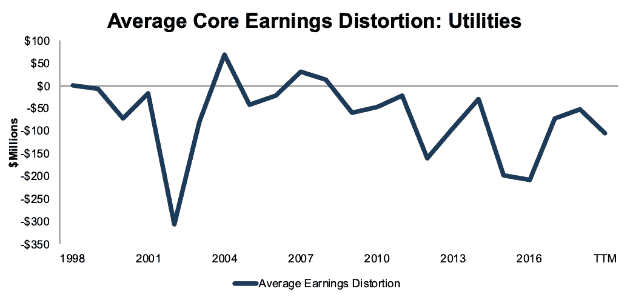
Historically, Utilities have rarely had overstated earnings. 1998, 2004, 2007, and 2008 are the only years out of the last 20 when the sector has had positive earnings distortion.
Figure 23: Utilities Average Core Earnings Distortion: 1998-TTM
Sources: New Constructs, LLC and company filings.
This article originally published on December 4, 2019.
Disclosure: David Trainer, Sam McBride, and Kyle Guske II receive no compensation to write about any specific stock, style, or theme.
Follow us on Twitter, Facebook, LinkedIn, and StockTwits for real-time alerts on all our research.
Click here to download a PDF of this report.
[1] Data in Figure 1 comes from the 2,764 companies for which we have TTM data. Number of companies by sector is as follows: Consumer Non-cyclicals – 127, Energy – 172, Telecom – 37, Industrials – 410, Basic Materials – 146, Utilities – 67, Healthcare – 339, Real Estate – 187, Consumer Cyclicals – 432, Financials – 422, Technology – 425.