
We closed this position on May 8, 2019. A copy of the associated Position Update report is here.
This consumer products company boasts a diverse portfolio of iconic name brands. What the firm lacks in growth potential due to its maturity and market share, it makes up for with dependably strong cash flows and corporate governance. The firm aligns executives’ and shareholders’ interests by tying compensation to economic earnings and has increased its return on invested capital (ROIC) for five consecutive years. Despite the positive storyline, market-implied expectations for future profit growth are low, which creates an attractive risk/reward scenario for the stock.
The Clorox Company (CLX) is this week’s Long Idea. CLX was also recently added to our Dividend Growth Stocks: August 2017 and Exec Comp Aligned with ROIC: September 2017 Model Portfolios.
Excellent Corporate Governance in Action
Compensation plans that tie executive compensation to improving ROIC are an underappreciated factor that investors should notice for two reasons. First, ROIC is the biggest driver of stock prices. Second, compensation plans that incentivize ROIC improvement align executives’ interests with shareholders’ interests.
We first highlighted CLX’s strong corporate governance in 2011. The clear strategic focus on maximizing economic profit, as well as the transparency and integrity of the financial reporting, were unprecedented at the time and remain best-in-class to this day. The most recent marketing presentation maintains “Maximize economic profit across categories, channels and countries” as the top objective of the overall “2020 Strategy.” The most recent Proxy statement outlines CLX’s executive compensation plan, which ties executive compensation to increasing economic earnings.
CLX’s economic earnings calculation differs somewhat from ours, but the end result has been very close. The 2017 10-K filing shows $525 million of economic earnings compared to $528 million in our model. As a result, performance targets are based on metrics that actually drive shareholder value, unlike many of the misleading “non-GAAP” earnings metrics in use today. Investors can also take comfort that management is not directly incentivized to destroy shareholder value, which is often the case (see here and here).
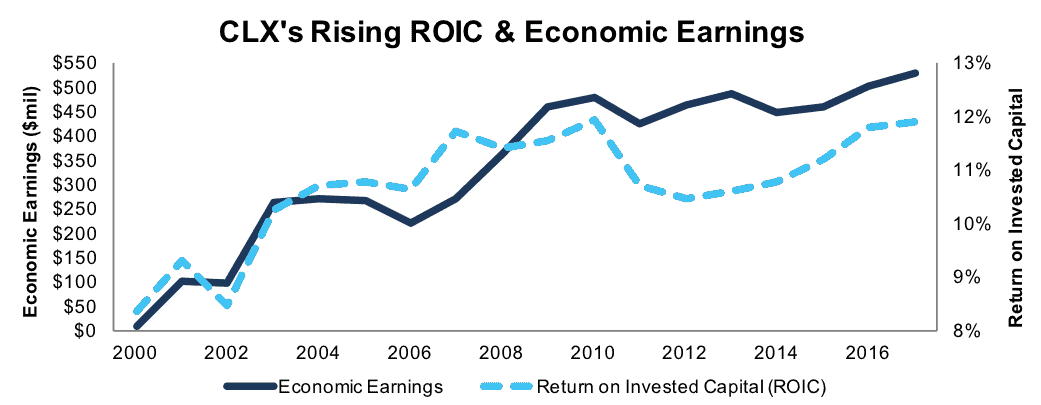
These properly-aligned management incentives have been accompanied by strong results. Per Figure 1, ROIC has improved in each of the past five years as part of a 15-year long-term uptrend.
Figure 1: CLX’s Executive Incentives Yield Favorable Results
Sources: New Constructs, LLC and company filings
Getting ROIC Right Matters
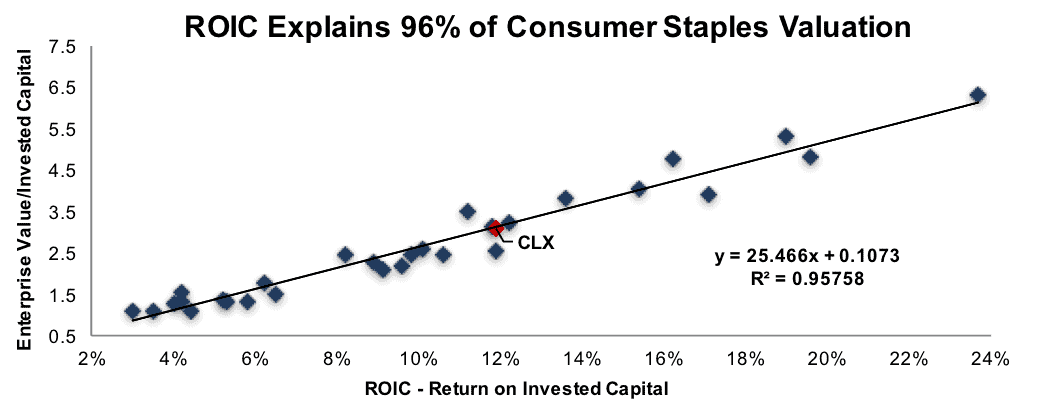
We know from numerous case studies, and Figure 2 below, that changes in ROIC and market value are directly correlated. As such, getting ROIC right is an important part of the investment decision making process. Our Robo-Analyst technology enables us to perform forensic accounting with scale and reverse accounting distortions to derive true recurring cash flows and an accurate invested capital. A recent white paper published by accounting firm Ernst & Young validates our efforts (see here: Getting ROIC Right). The paper shows material differences between the accuracy of our forensic accounting research and largest research providers.
Figure 2: Regression Analysis – ROIC vs. Valuation
Sources: New Constructs, LLC and company filings
How important is ROIC to valuation? Per Figure 2, ROIC explains 96% of the valuation difference between 30 top Consumer Staples stocks. Figure 2 also shows that CLX trades near the value implied by the peer group. The stocks of high-quality companies with high and rising ROICs rarely trade at deeply discounted valuations. In the case of CLX, we are comfortable riding the regression trend line higher as ROIC continues to rise.
CLX Posts Consistent Financial Results
Revenue has grown by 2% compounded annually over the past decade. After-tax profits (NOPAT) have grown 3% compounded annually over the same period. Over the past five years, revenue growth has remained consistent at 2% compounded annually while NOPAT growth has increased to 5% compounded annually. The acceleration of NOPAT growth was driven by improving margins.
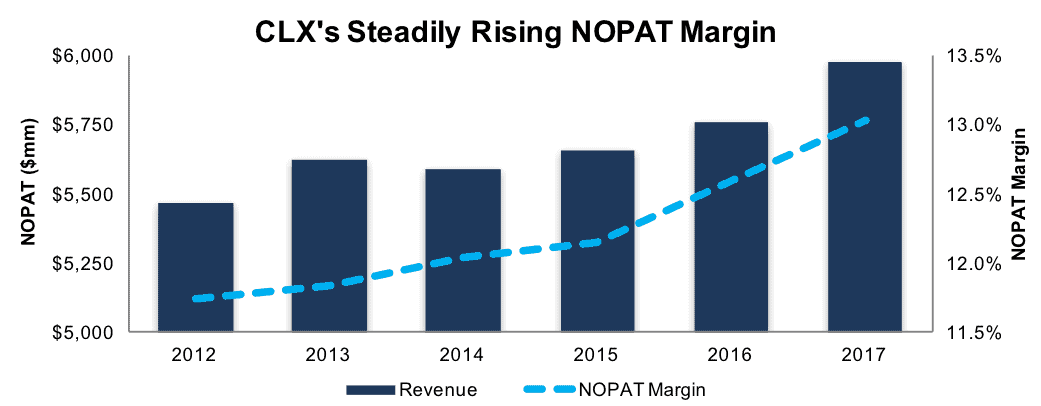
Per Figure 3, CLX’s NOPAT margin increased to 13% in 2017 from just under 12% in 2012 and improved slightly every year. CLX’s 0.9 ratio of invested capital turns (revenue/invested capital) translates a 13% NOPAT margin into 12% ROIC, which ranks in the second-quintile of our coverage universe. CLX’s ROIC has exceeded 10% since 2003. Invested capital turns have been stable at 0.9 since 2005.
CLX has generated cumulative free cash flow (FCF) of $3.3 billion (19% of market cap) over the past five years. The firm’s $724 million of FCF over the trailing twelve months (TTM) equates to a 4% FCF yield, which is double the FCF yield of the average S&P 500 stock.
Figure 3: CLX’s Consistent Financial Performance
Sources: New Constructs, LLC and company filings
True Earnings Growth Understated by GAAP
CLX provides an excellent example of why investors must distinguish between accounting and economic earnings. CLX’s economic earnings have grown 9% compounded annually since 1998 and 7% compounded annually over the past decade. This performance has been understated by GAAP net income, which has grown 5% compounded annually since 1998 and 3% compounded annually over the past decade.
Margin Trends Reflect Competitive Advantage
CLX breaks down revenue into the Cleaning (34%), Household (33%), International (17%) and Lifestyle (16%) segments. Over 80% revenues come from brands that have No. 1 or No. 2 market share in their respective product categories. CLX devotes significant focus and resources into innovative brand building efforts that seek to establish and maintain market leading positions for its premium products. The success of CLX’s products over generic alternatives is a testament to the success of these efforts and CLX’s strong competitive advantage.
CLX’s ability to continually improve its margins is another sign of strong competitive advantage. Figure 4 below shows the average before-tax profit (NOPBT) margin for the peer group defined in CLX’s Proxy statement. The use of NOPBT margin eliminates the impact of meaningful tax-rate differences within the group and focuses on operational efficiency.
CLX’s 20% (TTM) NOPBT margin ranks near the top of the group. CLX is the only company in the group to have increased NOPBT margin five consecutive years. In addition, CLX’s margin advantage over its average competitor has widened from 0.6% in 2012 to 3.4% TTM. The average competitor’s NOPBT margin (TTM) has declined by 0.6% since 2012 while CLX’s has increased by nearly 2.2%.
Figure 4: CLX’s Widening Margin Advantage
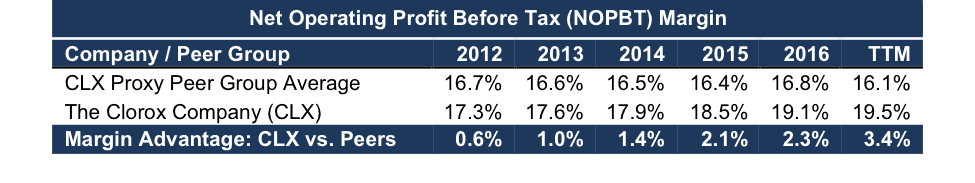
Comp Group Constituents: AVP, CHD, CL, CPB, DPS, EL, EPC, GIS, HRL, HSY, K, MCK, NWL, REV, SJM, TAP and TUP.
Sources: New Constructs, LLC and company filings
These high margins provide a buffer against adverse operating conditions, the capacity to invest for future growth, and the ability to navigate aggressive price competition while still maintaining an adequate ROIC. Furthermore, the ability to increase a margin advantage over peers for an extended period of time makes a strong statement about a company’s product pricing power and operational efficiency.
Bears’ Expectation for Margin Compression is Speculative at Best
Negative sentiment on food stocks (such as CAG, GIS and K) has started to impact the broader Consumer Staples sector. The concern is that fall-out from the Amazon (AMZN) induced grocery store price wars will spill over into all consumer products, make its way back up to all suppliers, and pressure their margins.
While the impact of AMZN on competing retail distribution channels is real and significant, reverberations back up the supply chain have been harder to identify. In the case of CLX, the impact has been non-existent to date. Trends over the past few years indicate CLX has strong pricing power in the Cleaning and Household products segment and is experiencing strong sales growth internationally. Growth in the international sales channel offsets the likelihood of having to bend to a single domestic distributor such as AMZN.
Companies like CLX have been dealing with low-price distribution channels like Wal-Mart (WMT) for decades. At this point, we see AMZN as another distribution channel for CLX products and view the case for AMZN-induced margin compression as speculative at best.
Continued Strong Execution is the Catalyst
As long as management continues to successfully execute their strategic plan to “maximize economic profit across categories, channels and countries,” the resulting uptrend in ROIC should continue to drive increased shareholder value. CLX management is confident that it can attain its revenue and income targets despite strong competitive challenges, and expects fiscal year 2018 to show continued growth in revenue and profits. Given the quality of CLX management and the impressiveness of their track record to date, we are inclined to trust their assessment of current market conditions and outlook for the company.
Low Profit Growth Expectations Embedded in the Stock
At its current price of $135/share, CLX has a price-to-economic book value (PEBV) ratio of 1.1. This ratio means the market expects CLX’s NOPAT to grow no more than 10% over the remaining life of the firm. This expectation seems overly conservative for a firm with pricing power of dominant consumer brands. For comparison, we note CLX’s NOPAT has grown 21% cumulatively over the past five years alone.
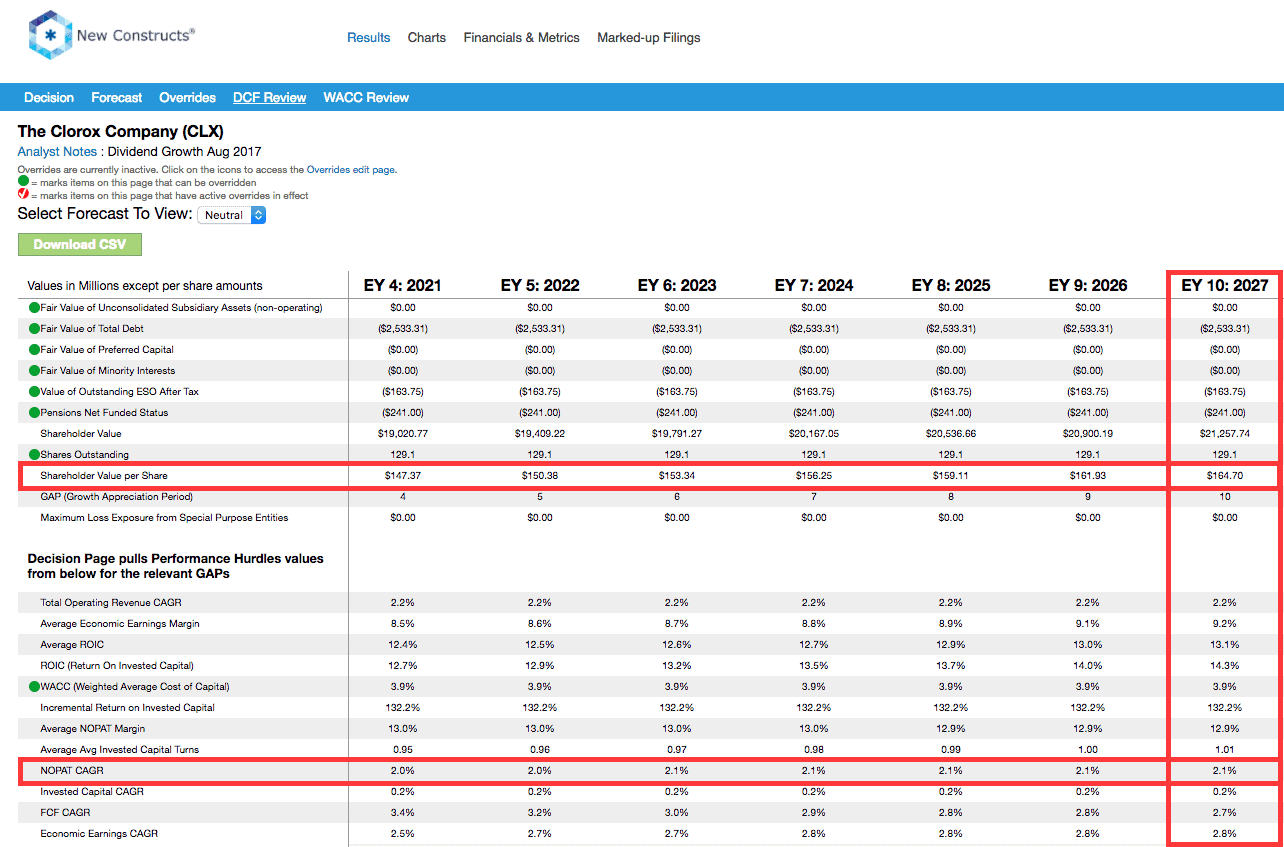
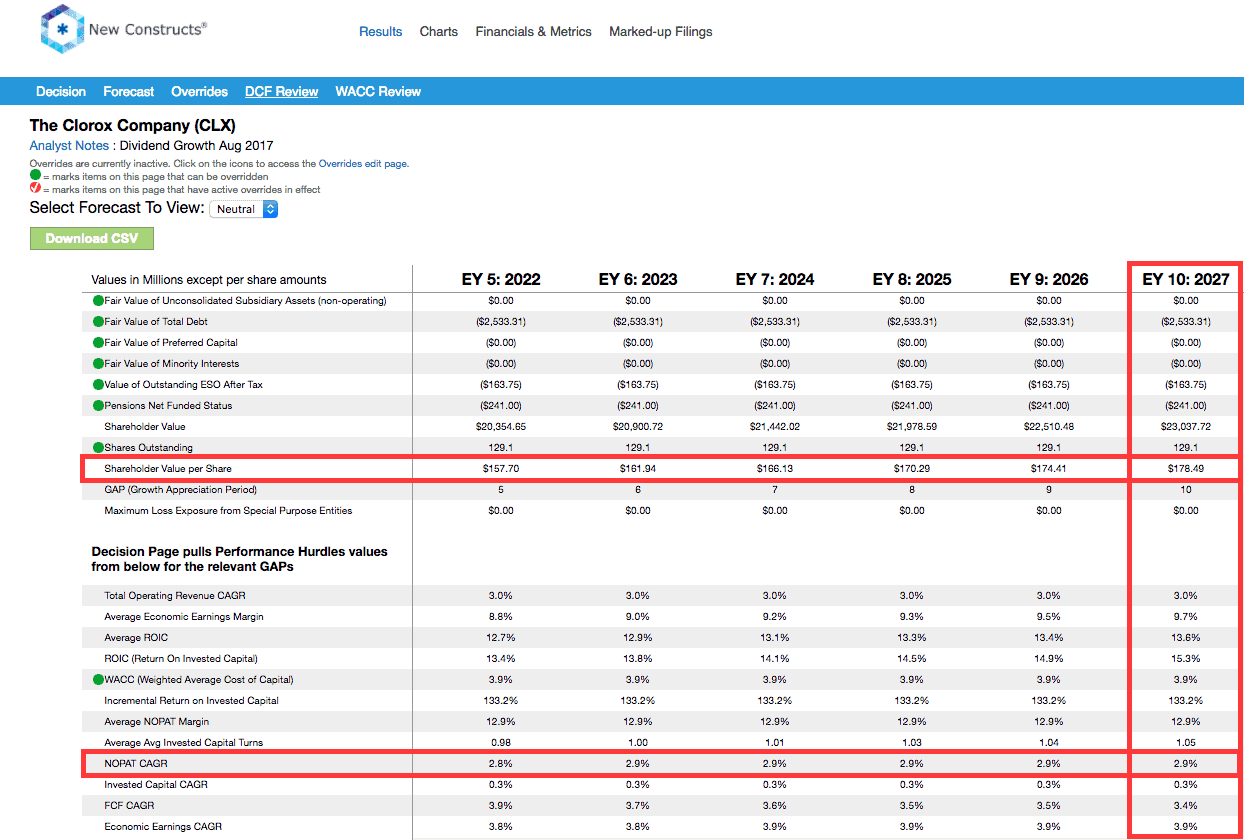
If CLX can maintain current NOPAT margins (13% TTM) and grow NOPAT by 2% compounded annually over the next decade, the stock is worth $165/share today – a 22% upside. In a more optimistic scenario of 3% compound annual NOPAT growth over the next decade, the stock is worth $178/share today – a 32% upside.
Each of these scenarios assumes 2% compound annual revenue growth, which has consistently been the case over the past three-, five- and ten-year periods. The first scenario assumes NOPAT grows in line with revenue. The second scenario assumes NOPAT grows slightly faster than revenue due to additional improvement in NOPAT margin. The second scenario is a close approximation of actual CLX results over the past decade.
40-Year Dividend Growth Streak: Another Good Sign
A long streak of dividend increases is also widely considered to be a sign of a company’s strong competitive advantage. CLX has increased its dividend for 40 consecutive years. CLX’s current annualized dividend of $3.36/share equates to 7% compound annual growth compared to $2.44/share dividend paid in 2012. Past dividend growth has been enabled by CLX’s growing NOPAT and free cash flow. These trends also bode well for future dividend growth potential.
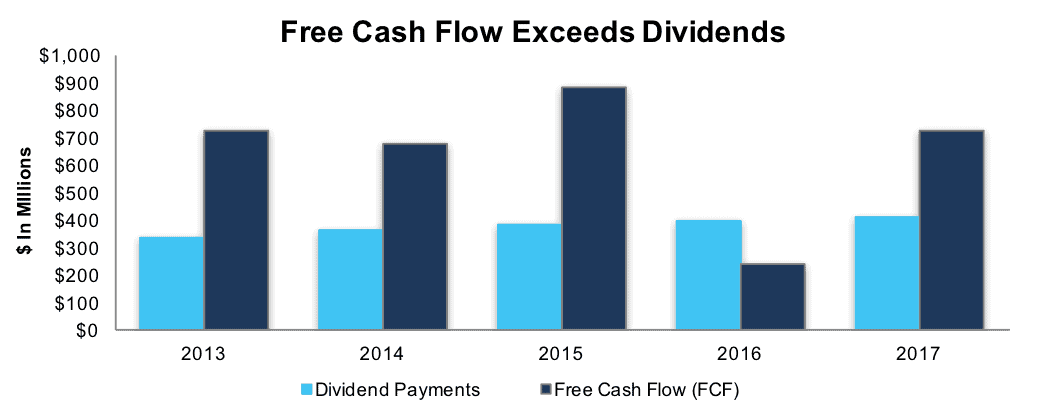
Per Figure 5, CLX has paid out cumulative dividends of $1.9 billion compared to cumulative cash flow of $3.3 billion over the past five years. CLX’s FCF over the trailing twelve months ($724 million) equates to 170% of the annual cash dividend payment based on a $3.36/share annual dividend. Companies with FCF well in excess of dividend payments provide higher quality dividend growth opportunities because we know the firm generates the cash to support the current dividend as well as a higher dividend.
Figure 5: CLX Free Cash Flow (FCF) vs. Dividend Payments
Sources: New Constructs, LLC and company filings
Total Shareholder Yield Could Approach 7%
CLX has an open-market share repurchase authorization of up to $750 million, all of which was available as of June 30, 2017. Full-use of the authorization would equate to 4% of outstanding shares and yield of over 4% to shareholders. When combined with the current 2.5% dividend yield, the total yield to shareholders could approach 7%. However, CLX management has been more focused on returning excess capital to shareholders via dividends. As such, we would not expect to see a material increase in share repurchase activity without a significant decline in the stock price. The company repurchased just 50,000 shares last quarter, which was done to offset the dilutive impact of stock-based compensation.
Insider Trading and Short Interest
There is little insight to be gained from recent insider or short interest trends. Insiders own 0.6% of the company. Insider trading activity has totaled only 81,000 shares year-to-date (13% of a single day’s volume), which has been universally on the sell side. Current short interest is 4.9 million shares, or 4% of the float and 8 days to cover. This level is down slightly from 5.2 million shares to start the year. Short interest down is significantly from the 13 million share peak seen in mid-2014. Since that time, CLX’s strong fundamental and stock price performance has caused these short sellers to capitulate.
Auditable Impact of Footnotes & Forensic Accounting Adjustments
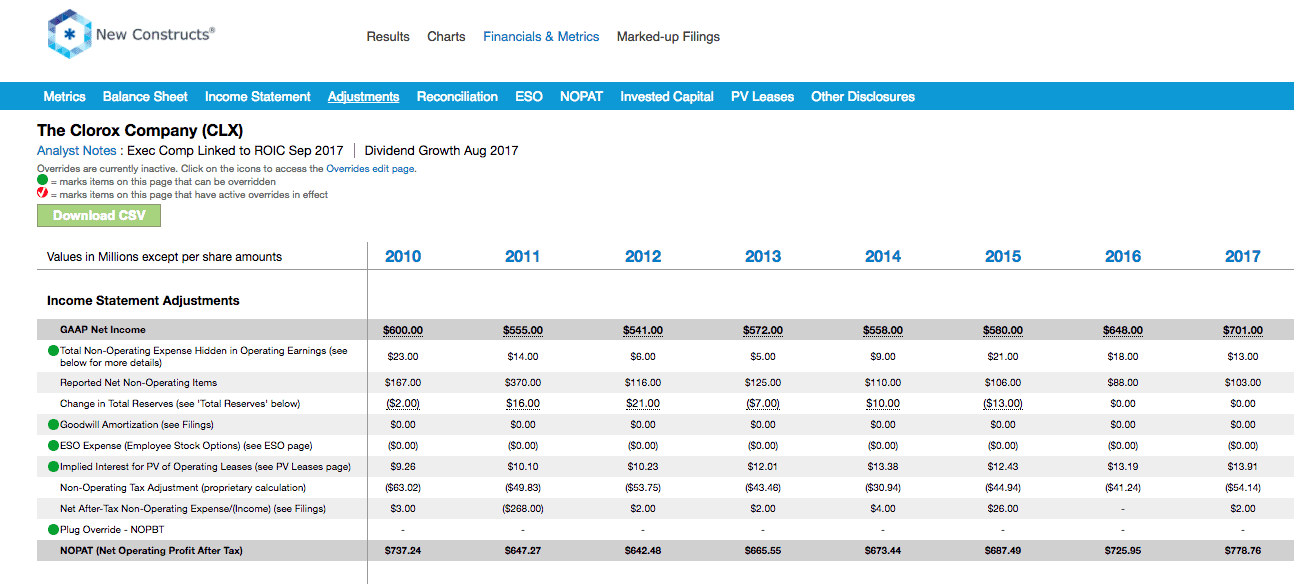
Our Robo-Analyst technology enables us to perform forensic accounting with scale and provide the research needed to fulfill fiduciary duties. In order to derive the true recurring cash flows, an accurate invested capital, and an accurate shareholder value, we made the following adjustments to The Clorox Company’s 2017 10-K:
Income Statement: we made $262 million of adjustments with a net effect of removing $78 million in non-operating expense (1% of revenue). We removed $170 million related to non-operating expenses and $92 million related to non-operating income. See all adjustments made to CLX’s income statement here.
Balance Sheet: we made $4.2 billion of adjustments to calculate invested capital with a net increase of $3.8 billion. The most notable adjustment was $1.7 billion (62% of reported net assets) related to accumulated goodwill. See all adjustments to CLX’s balance sheet here.
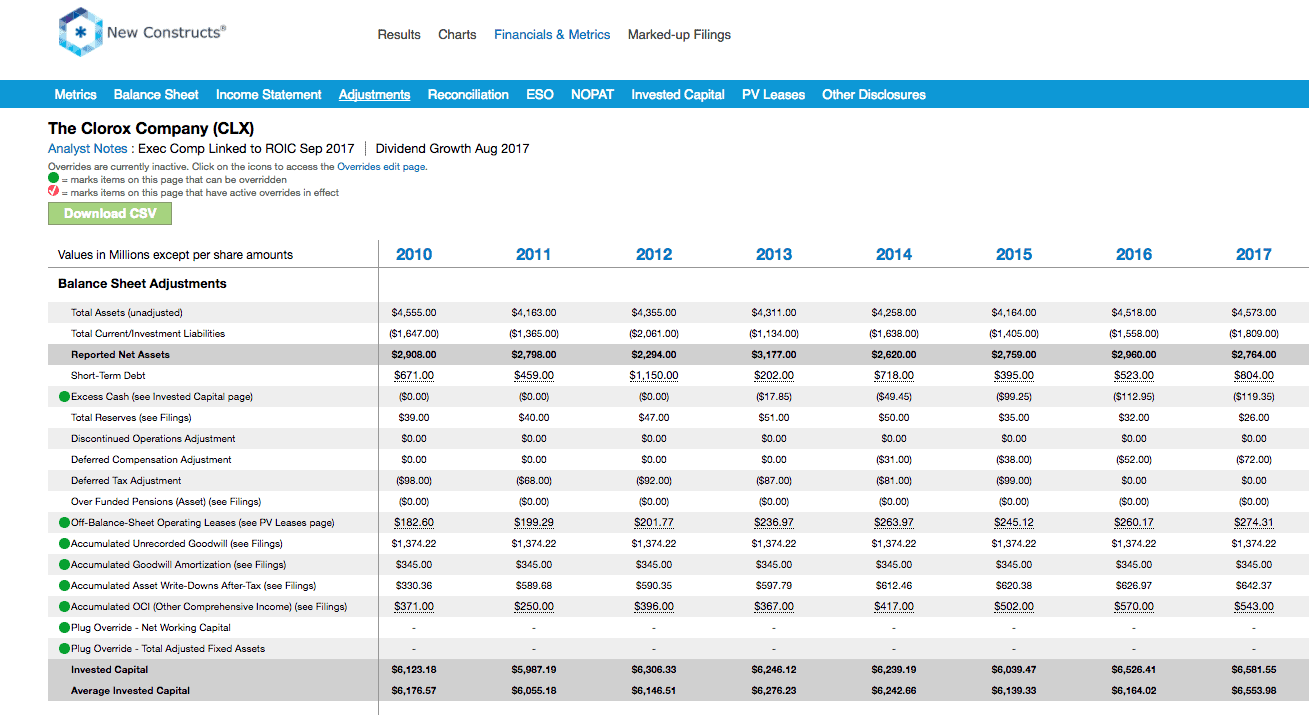
Valuation: we made $3.2 billion of adjustments with a net effect of decreasing shareholder value by $2.8 billion. The largest adjustment to shareholder value was $2.5 billion in total debt, which includes $274 million of off-balance sheet operating leases. This debt adjustment represents 15% of CLX’s market value. Despite the decrease in shareholder value, CLX remains undervalued.
Attractive Funds That Hold CLX
The following funds receive our Attractive-or-better rating and allocate significantly to CLX.
- Parnassus Core Equity Fund (PRILX) – 3.0% allocation and Very Attractive rating
- Ivy Mid Cap Income Opportunities Fund (IVOYX) – 2.9% allocation and Attractive rating
- Rydex S&P 500 Equal Weight Consumer Staples (RHS) – 2.9% allocation and Very Attractive Rating
- AIG ESG Dividend Fund (EDFAX) – 2.8% allocation and Very Attractive rating
- Congress Large Cap Growth Fund (CMLIX) – 2.4% allocation and Attractive rating
This article originally published on September 21, 2017.
Disclosure: David Trainer, Kenneth James, and Kyle Guske II receive no compensation to write about any specific stock, style, or theme.
Follow us on Twitter, Facebook, LinkedIn, and StockTwits for real-time alerts on all our research.
Click here to download a PDF of this report.
Photo Credit: Jack Bonner (Flickr)