
We closed this position on March 12, 2021. A copy of the associated Position Update report is here.
It’s not often investors get the chance to buy leading businesses at significant discounts. Investors willing to look past the dip in economic activity can find great value. This firm has the cash flows and balance sheet to survive the downturn and is well positioned to grow profits during the economic recovery. Darden Restaurants (DRI: $62/share) is this week’s Long Idea.
DRI’s History of Profit Growth
DRI is down 43% year-to-date (YTD) and trades at its cheapest valuation, as measured by price-to-economic book value (PEBV), in the history of our model (dates back to 1998). For investors willing to look past the current crisis, DRI represents a great buying opportunity.
Prior to the COVID-19 outbreak, DRI had a strong history of profit growth. Since 2014, (the year DRI sold Red Lobster) DRI grew revenue by 6% compounded annually and core earnings[1] by 30% compounded annually, per Figure 1. Longer term, DRI has grown core earnings by 5% compounded annually over the past decade. The firm increased its core earnings margin year-over-year (YoY) in four of the past five years and its core earnings margin of 8% over the trailing-twelve-months (TTM) is up from 3% in 2014.
Figure 1: DRI Core Earnings & Revenue Growth Since 2014
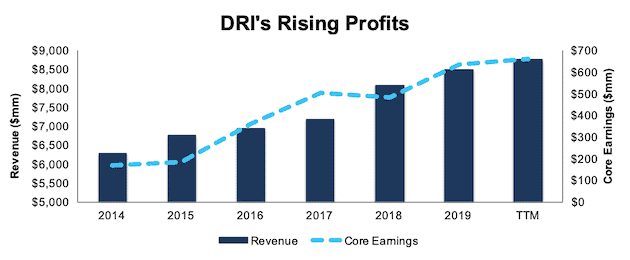
Sources: New Constructs, LLC and company filings
DRI’s rising profitability helps the business generate significant free cash flow (FCF). The company generated positive FCF in seven of the past 10 years and a cumulative $1.6 billion (22% of market cap) over the past five years. DRI’s $878 million in FCF over the TTM period equates to an 8% FCF yield, which is significantly higher than the Consumer Cyclicals sector average of 1%.
Darden’s Balance Sheet Provides Ample Liquidity to Survive the Crisis
In mid-March Darden announced it was fully drawing its $750 million credit facility, which, when combined with $322 million in cash and equivalents at the end of fiscal 3Q20, gives the company over $1 billion in available liquidity. In the same announcement, Darden noted it was also suspending its dividend to preserve liquidity.
In early April, Darden announced it entered into a $270 million term loan to “maximize financial flexibility and further bolster liquidity.” The term loan matures on April 5, 2021 and can be increased by $100 million at the request of the company.
Best of all, Darden has been able to slow its cash burn through an increase in to-go sales (more details later). On April 7, 2020, the firm estimated its weekly cash burn was ~$25 million. However, two weeks later, on April 20, 2020, Darden noted its weekly cash burn had improved to ~$20 million. At this burn rate, Darden has nearly one year of available liquidity. It would take nearly 38 weeks to exhaust the firm’s $750 million credit facility and another 13 weeks to exhaust its latest $270 million term loan.
Even in the worst-case scenario, in which Darden’s restaurants are fully closed, management estimated its weekly cash burn would be $40-$50 million. In other words, Darden could operate for over 22 weeks, or until ~September 8, 2020, with zero revenue before exhausting the credit facility and term loan.
Superior Profitability to Survive and Thrive
Before the current crisis, Darden’s profitability was trending higher at a faster pace than its competitors. This superior profitability is a testament to DRI’s strong business model, which leverages its economies of scale across the restaurant industry. High profitability also provides DRI with greater resources to survive the current downturn, while also benefiting from the economic bounce back once we’re clear of the COVID-19 constraints on economic activity.
Per Figure 2, DRI’s net operating profit after-tax (NOPAT) margin has improved from 5.6% in 2015 to 9.1% TTM. Meanwhile, the market-cap-weighted average of the full-service restaurant peers under coverage has fallen from 8.6% to 7.9% over the same time. Peers in the group include Bloomin’ Brands (BLMN), The Cheesecake Factory (CAKE), Brinker International (EAT), Cracker Barrel Old Country Store (CBRL), and more.
Figure 2: DRI’s NOPAT Margin Vs. Competitors
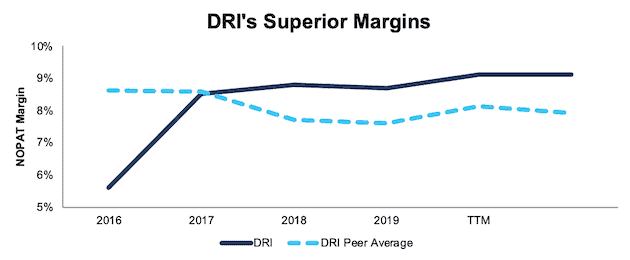
Sources: New Constructs, LLC and company filings.
DRI’s capital efficiency, while below the market-cap-weighted average of peers, has improved from 1.1 in 2015 to 1.2 TTM. The peer average has improved from 1.3 to 1.4 over the same time.
The combination of rising margins and invested capital turns drives DRI’s ROIC higher. DRI has improved its ROIC from 6% in 2015 to 11% TTM. Per Figure 3, the market-cap-weighted average ROIC of peers, while improving, has increased at a slower rate than DRI. While DRI’s ROIC lagged peers in 2015, it was higher in each of the last three years and the TTM period.
Figure 3: DRI’s ROIC vs. Competitors
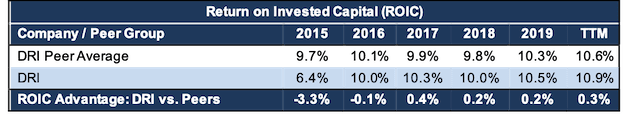
Sources: New Constructs, LLC and company filings.
DRI’s superior profitability shows that its investment in restaurant operations, supply chain management, and technology (online/mobile ordering for instance) give it a competitive advantage. Moving forward, DRI’s higher profitability allows the firm to survive the current downturn and better adapt to decreased demand in the restaurant sector by shifting focus to to-go orders.
Bear Case Assumes Restaurant Industry Never Recovers
There’s no denying that the COVID-19 pandemic, has, and will, permanently alter the overall restaurant industry. With over 1,800 company-owned restaurants (as of February 23, 2020), and nearly three-fourths of revenue coming from two restaurant brands, DRI will certainly feel some pain.
However, DRI’s current valuation implies that (1) DRI won’t generate any revenue during the pandemic and (2) the current crisis is not temporary, but a permanent decline in economic activity.
Figure 4: Darden Restaurant-Type Revenue Breakdown – TTM
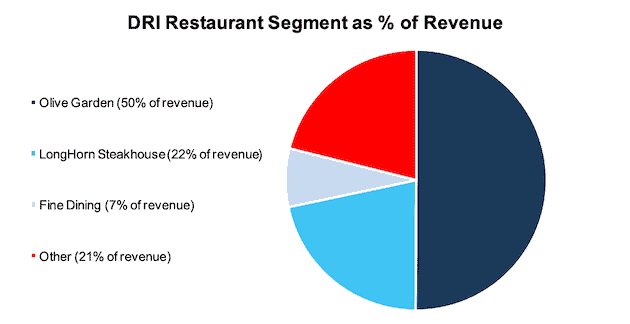
Sources: New Constructs, LLC and company filings
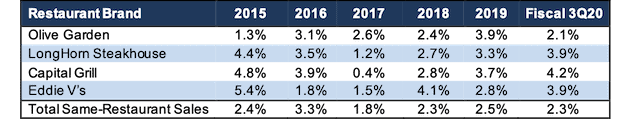
To buy into this valuation, one must ignore the strength of Darden’s restaurant brands, and the firm’s ability to attract customers. Per Figure 5, four of Darden’s restaurant brands, and the company as a whole have grown same-restaurant sales (SRS) YoY for five consecutive years.
Naturally, we expect SRS to decline sharply in the short term, but we, along with the International Monetary Fund (IMF) and nearly every economist in the world, believe that U.S. GDP growth will be higher in 2021 than expected before the pandemic. Accordingly, it is safe to assume the restaurant business will return to something, at a minimum, approaching historical levels. In which case, Darden is well-positioned to capitalize on the long-term demand to eat out, continue to grow profits, and take the market share left by the restaurants that do not survive.
Figure 5: Darden Brands Growing Same-Restaurant Sales
Sources: New Constructs, LLC and company filings
Finding Revenue Growth in COVID Adversity: To-Go Business Is Booming
Darden, in particular Olive Garden, has an advantage over other restaurants that allows it to better withstand the drop in demand from in-restaurant sales: to-go and delivery (off-premise). Even before the COVID crisis, DRI was investing and growing its to-go offerings. For the quarter ended on November 24, 2019, DRI reported that 17% of Olive Garden’s total sales were off-premise. For the quarter ended on February 23, 2020, the firm reported that it was ramping up off-premise operations as restaurants were starting to close their seating across the country.
More recently, Darden provided an update on its business through April 19, 2020 and, as expected, overall SRS were down significantly from prior periods. However, to-go sales are rising at a rapid pace. Per Figure 6, to-go sales per restaurant for the week ending 4/19/20 more than tripled and quadrupled at Olive Garden and LongHorn Steakhouse since the week ending 3/1/20.
Figure 6: Darden To-Go Sales Seeing Increased Demand

Sources: New Constructs, LLC and company filings
As customers increasingly order food to-go, Darden is able to meet the demand. Providing a seamless and efficient process (speaking from experience as a recent buyer of Olive Garden’s to-go food) helps build customer loyalty, both during the crisis and beyond.
More importantly, these to-go orders give Darden a revenue stream that provides needed cash flow to survive the crisis and deeper customer relationships to leverage once business returns to a more normal state.
Market Share for the Taking After COVID-19
The stark reality is many smaller restaurants will not survive the current crisis. A study in late March conducted by the National Restaurant Association found that 11% of restaurant owners and operators anticipated they would permanently close within the next 30 days. DRI’s financial position, along with its well-known brands, provide an excellent opportunity to gain market share after the COVID-19 impacts subside and consumers can eat out again.
DRI Trades at Cheapest Level in Years
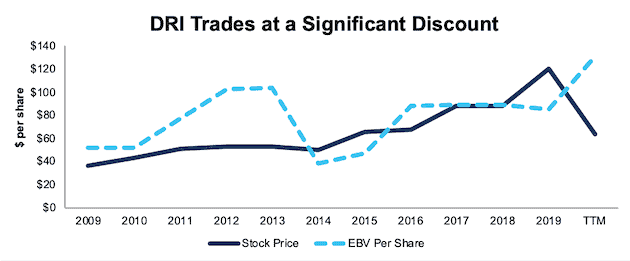
After falling 43% YTD, DRI now trades significantly below its economic book value and at its cheapest level in the history of our model. At its current price of $62/share, DRI has a price-to-economic book value (PEBV) ratio of 0.5. This ratio means the market expects DRI’s NOPAT to permanently decline by 50%. This expectation seems overly pessimistic over the long term. For reference, DRI actually grew NOPAT YoY in 2007, 2008, and 2009 (the last prolonged economic downturn).
DRI’s current economic book value, or no-growth value, is $131/share – a 111% upside to the current price.
Figure 7: DRI’s Stock Price vs. Economic Book Value (EBV)
Sources: New Constructs, LLC and company filings.
DRI’s Current Price Implies Worst-Case Scenario
Below, we use our reverse DCF model to quantify the cash flow expectations baked into DRI’s current stock price. Then, we analyze the implied value of the stock based on different assumptions about COVID-19’s impact on the restaurant industry and DRI’s future growth in cash flows.
Scenario 1: Using industry projections, DRI’s current revenue, and its historical margins, we can model the worst-case scenario already implied by DRI’s current stock price. In this scenario, we assume the following:
- NOPAT margins permanently fall to 6.4% (average throughout company history, compared to 9.1% TTM)
- Restaurant industry sales fall 27% in 2020 – which is the worst-case scenario proposed by Technomic, a foodservice industry research provider – and don’t grow again for two more years
- Sales begin growing again in 2023, but only at 3.5% a year, which equals the average global GDP growth rate since 1961
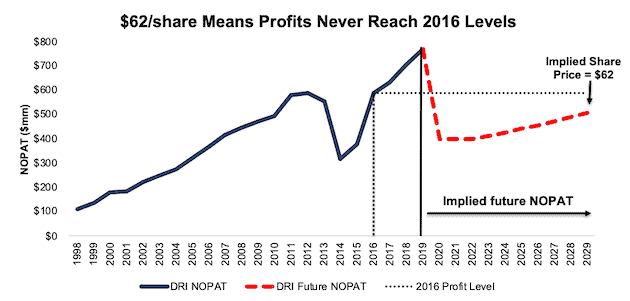
In this scenario, where DRI’s NOPAT declines 48% in 2020 and 4% compounded annually over the next decade, the stock is worth $62/share today – equal to the current stock price. See the math behind this reverse DCF scenario.
Figure 8 compares the stock’s implied future NOPAT to the firm’s historical NOPAT in this scenario. This worst-case scenario implies DRI’s NOPAT 10 years from now will be 34% below its 2019 NOPAT. In other words, this scenario implies that a decade after the COVID-19 pandemic, Darden’s profits will have only recovered to be greater than 2015 profits but still slightly below 2016 profits. In any scenario better than this one, DRI holds significant upside potential, as we’ll show below.
Figure 8: Current Valuation Implies Severe, Long-Term Decline in Profits: Scenario 1
Sources: New Constructs, LLC and company filings.
Scenario 2: Cheap Valuation Provides Significant Upside
If we assume, as does the IMF in its base case for GDP growth, that the pandemic threat is lessened in the second half of the year and the global economy grows strongly in 2021, DRI looks even more undervalued.
In this scenario, we assume:
- NOPAT margins fall to 8.1% in 2020 (average of past five years) before returning to TTM levels (9.1%) in the following years
- Restaurant industry sales fall 17% in 2020, which is the mid-case scenario outlined by Technomic
- Sales growth returns in 2021 at the IMF’s global base-case GDP growth rate of 5.8%
- Sales continue to grow at 3.5% a year, or the average global GDP growth rate sine 1961, each year thereafter
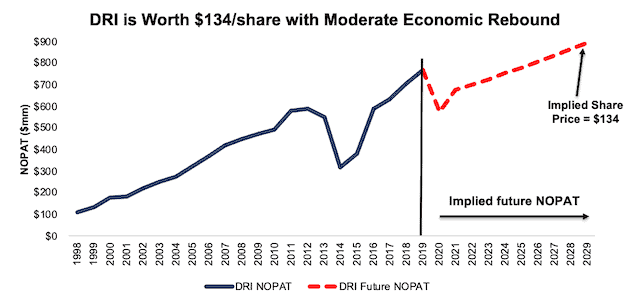
In this scenario, DRI’s NOPAT falls 25% in 2020 and grows by just 2% compounded annually over the next decade, and the stock is worth $134/share today – a 116% upside to the current price. See the math behind this reverse DCF scenario.
It’s not often investors get the opportunity to buy an industry leader at such a discounted price.
Figure 9 compares the stock’s implied future NOPAT to the firm’s historical NOPAT in scenario 2.
Figure 9: Implied Profits Assuming Global Recovery in 2021: Scenario 2
Sources: New Constructs, LLC and company filings.
Sustainable Competitive Advantages Will Drive Shareholder Value Creation
Here’s a summary of why we think the moat around DRI’s business will enable it to continue to generate higher NOPAT than the current market valuation implies. The following competitive advantages help DRI profitability serve customers and prevent competition from taking market share:
- Higher profitability than competitors
- Economies of scale throughout its network of 1,800 restaurants
- Ample liquidity to survive downturn
- To-go business provides growth opportunities post COVID-19 pandemic
What Noise Traders Miss with DRI
These days, fewer investors focus on finding quality capital allocators with shareholder friendly corporate governance. Instead, due to the proliferation of noise traders, the focus is on short-term technical trading trends while high-quality fundamental research is overlooked. Here’s a quick summary of what noise traders are missing:
- Core earnings growth and free cash flow generation over the past decade
- Industry leader in a great position to excel after the global pandemic subsides
- Valuation implies the economy never fully recovers from COVID-19
Executive Compensation Plan Could Be Improved
DRI executives’ annual bonuses are awarded based on the achievement of company performance measures such as adjusted EPS, same-restaurant sales growth, adjusted operating income, and more. Executives’ long term bonuses are awarded in stock options, restricted stock units, and performance stock units (PSU). The PSUs are tied to relative total shareholder return goals.
We would prefer DRI return to its executive compensation plan used in 2017, which awarded PSUs that were tied to three-year average ROIC and relative total shareholder return. There is a strong correlation between improving ROIC and increasing shareholder value and not using ROIC in executive compensation is a step in the wrong direction.
Despite using different metrics such as total shareholder return and adjusted EPS, DRI’s plan has not compensated executives while destroying shareholder value. DRI has grown economic earnings by 4% compounded annually over the past decade and 16% compounded annually over the past two decades.
Suspended Dividend Should Be Temporary
As noted above, DRI management recently suspended its quarterly dividend to maintain flexibility and liquidity during the current economic downturn. Prior to this suspension, DRI’s dividend provided a 5.7% yield, and the firm had increased its dividend in eight of the last 10 years. We expect the current suspension to be temporary, and for DRI to return capital to shareholders through dividends again after the economy rebounds.
In the past five years, DRI has generated more in free cash flow than it has paid out in dividends. DRI generated a cumulative FCF of $1.6 billion over the past five years and paid out $1.5 billion in dividends over the same time. FCF exceeded dividend payments by an average of $24 million per year over this time.
Firms with cash flows greater than dividend payments have a higher likelihood to maintain and grow dividends. While DRI suspended its dividend in the short term, investors buying at current prices should get a nice yield with upside potential as DRI reinstates the dividend over the long-term.
In addition to dividends, DRI has returned capital to shareholders through share repurchases. The firm repurchased nearly $208 million worth of shares in fiscal 2019 and had repurchased $300 million through the nine months ended February 23, 2020. DRI was authorized to repurchase up to $321 million more shares. DRI’s management already announced they have suspended repurchase activity. When the firm restarts share repurchases once the crisis is over, the yield for investors will only increase.
An Earnings Beat of Depressed Expectations Could Send Shares Higher
According to Zacks, consensus estimates at the end of February pegged DRI’s 2020 earnings at $6.74/share. Jump forward to April 21, and consensus estimates for DRI’s 2020 earnings have fallen to just $2.89/share.
While the short-term impact of the COVID-19 pandemic is yet to be seen, these lowered expectations provide a great opportunity for a high-quality business, such as DRI, to beat consensus estimates. Though our current Earnings Distortion Score for DRI is “In-Line”, DRI beat earnings estimates in each of the past 12 quarters, and doing so again, in the midst of such market turmoil, could send shares higher.
Insider Trading and Short Interest Trends
Over the past 12 months, insiders have purchased a total of 1.5 thousand shares and sold 166 thousand shares for a net effect of 165 thousand shares sold. These sales represent less than 1% of shares outstanding.
There are currently 5.9 million shares sold short, which equates to 5% of shares outstanding and two days to cover. Short interest is up 8% from the prior month, which indicates investors are too focused on the dip and not the recovery afterwards.
Critical Details Found in Financial Filings by Our Robo-Analyst Technology
As investors focus more on fundamental research, research automation technology is needed to analyze all the critical financial details in financial filings as shown in the Harvard Business School and MIT Sloan paper, "Core Earnings: New Data and Evidence”.
Below are specifics on the adjustments we make based on Robo-Analyst findings in Darden Restaurants’s 2019 10-K:
Income Statement: we made $345 million of adjustments with a net effect of removing $57 million in non-operating expenses (1% of revenue). See all adjustments made to DRI’s income statement here.
Balance Sheet: we made $3.3 billion of adjustments to calculate invested capital with a net increase of $2.9 billion. One of the most notable adjustments was $2.4 billion (53% of reported net assets) in operating leases. See all adjustments to DRI’s balance sheet here.
Valuation: we made $3.9 billion of adjustments with a net effect of decreasing shareholder value by $3.9 billion. There were no adjustments that increased shareholder value. Apart from $3.4 billion in total debt, which includes the operating leases noted above, the most notable adjustment to shareholder value was $238 million in deferred compensation assets. This adjustment represents 3% of DRI’s market cap. See all adjustments to DRI’s valuation here.
Attractive Funds That Hold DRI
The following funds receive our Attractive-or-better rating and allocate significantly to Darden Restaurants.
- Catalyst/Lyons Tactical Allocation Fund (CLTIX) – 3.5% allocation and Very Attractive rating.
- World Funds Applied Finance Dividend Fund (AFVDX) – 3.1% allocation and Attractive rating.
- AdvisorShares Vice ETF (ACT) – 3.1% allocation and Attractive rating.
- Capital Series Guardian Dividend Growth Fund (DIVGX) – 2.5% allocation and Attractive rating.
- World Funds Applied Finance Select Fund (AFVZX) – 2.1% allocation and Very Attractive rating.
This article originally published on April 22, 2020.
Disclosure: David Trainer, Kyle Guske II, and Matt Shuler receive no compensation to write about any specific stock, style, or theme.
Follow us on Twitter, Facebook, LinkedIn, and StockTwits for real-time alerts on all our research.
[1] Our core earnings are a superior measure of profits, as demonstrated in In Core Earnings: New Data & Evidence a paper by professors at Harvard Business School (HBS) & MIT Sloan. The paper empirically shows that our data is superior to IBES “Street Earnings”, owned by Blackstone (BX) and Thomson Reuters (TRI), and “Income Before Special Items” from Compustat, owned by S&P Global (SPGI).