
Three new stocks make May’s Exec Comp Aligned with ROIC Model Portfolio, available to members as of May 16, 2018.
Recap from April’s Picks
Our Exec Comp Aligned with ROIC Model Portfolio (+0.6%) underperformed the S&P 500 (+2.8%) last month. The best performing stock in the portfolio was Nautilus Group (NLS), which was up 15%. Overall, four out of the 15 Exec Comp Aligned with ROIC Stocks outperformed the S&P in April, and seven had positive returns.
Since inception, this model portfolio is up 27% while the S&P 500 is up 26%.
The success of this Model Portfolio highlights the value of our Robo-Analyst technology[1], which scales our forensic accounting expertise (featured in Barron’s) across thousands of stocks.
This Model Portfolio only includes stocks that earn an Attractive or Very Attractive rating and align executive compensation with improving ROIC. We think this combination provides a uniquely well-screened list of long ideas because return on invested capital (ROIC) is the primary driver of shareholder value creation.[2]
New Stock Feature for May: O’Reilly Automotive, Inc. (ORLY: $272/share)
O’Reilly Automotive (ORLY), an automotive aftermarket parts retailer, is the featured stock in May’s Exec Comp Aligned with ROIC Model Portfolio.
Over the past decade, ORLY has grown revenue by 14% compounded annually and after-tax operating profit (NOPAT) by 20% compounded annually. ORLY has managed to grow profits faster than revenue by increasing its NOPAT margin from 8% in 2007 to 13% over the last twelve months. Further highlighting the strength of its business, ORLY has generated cumulative free cash flow (FCF) of $4.1 billion (18% of market cap) over the past five years.
Figure 1: ORLY’s Revenue & NOPAT Since 2007
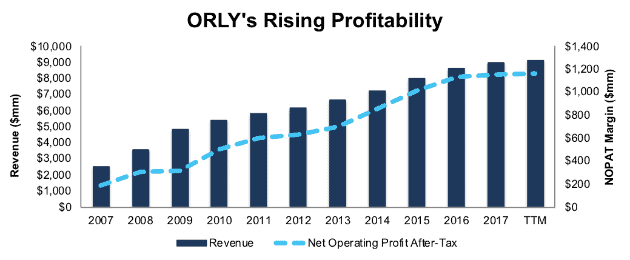
Sources: New Constructs, LLC and company filings
Executive Compensation Plan Helps Drive Shareholder Value Creation
O’Reilly has included ROIC as a performance metric in its executive compensation plan since 2013. In 2017, 20% of annual incentive compensation awards were tied to ROIC. This focus on ROIC has led to O’Reilly’s ROIC improving from 12% in 2012 (year before ROIC was added) to 21% TTM. O’Reilly’s exec comp plan lowers the risk of investing in the company’s stock because know executives are held accountable for creating real profits.
Valuation Still Provides Upside Potential
Despite the strong fundamentals, ORLY is up just 4% over the past four years while the S&P 500 is up 30%. At its current price of $272/share, ORLY has a price-to-economic book value (PEBV) ratio of 1.3. This ratio means the market expects ORLY’s NOPAT to grow by no more than 30% over the remaining life of the firm. This expectation seems rather conservative give O’Reilly has grown NOPAT by 20% compounded annually since 1998.
If ORLY can maintain TTM margins (13%) and grow NOPAT by just 5% compounded annually for the next decade, the stock is worth $329/share today – a 20% upside. See the math behind this dynamic DCF scenario here.
ORLY is more expensive than the companies we usually feature, which tend to have a PEBV of 1.2 or below. However, as Warren Buffett once wrote, “It’s far better to buy a wonderful company at a fair price than a fair company at a wonderful price.”
Critical Details Found in Financial Filings By Our Robo-Analyst Technology
As investors focus more on fundamental research, research automation technology is needed to analyze all the critical financial details in financial filings. Below are specifics on the adjustments we make based on Robo-Analyst findings in O’Reilly Automotive’s 2017 10-K:
Income Statement: we made $352 million of adjustments, with a net effect of removing $16 million in non-operating expense (<1% of revenue). We removed $168 million in non-operating income and $184 million in non-operating expenses. You can see all the adjustments made to ORLY’s income statement here.
Balance Sheet: we made $1.9 billion of adjustments to calculate invested capital with a net increase of $1.7 billion. One of the largest adjustments was $1.8 billion due to operating leases. This adjustment represented 47% of reported net assets. You can see all the adjustments made to ORLY’s balance sheet here.
Valuation: we made $5.1 billion of adjustments with a net effect of decreasing shareholder value by $5.1 billion. There were no adjustments that increased shareholder value. Apart from $5 billion in total debt, which includes the operating leases noted above, one of the largest adjustments to shareholder value was $90 million in deferred tax liabilities. This adjustment represents <1% of ORLY’s market cap. Despite the net decrease in shareholder value, ORLY remains undervalued.
This article originally published on May 22, 2018.
Disclosure: David Trainer, Kyle Guske II, and Sam McBride receive no compensation to write about any specific stock, style, or theme.
Follow us on Twitter, Facebook, LinkedIn, and StockTwits for real-time alerts on all our research.
[1] Harvard Business School features the powerful impact of our research automation technology in the case New Constructs: Disrupting Fundamental Analysis with Robo-Analysts.
[2] Ernst & Young’s recent white paper, “Getting ROIC Right”, proves the superiority of our research and analytics.
Click here to download a PDF of this report.
Photo Credit: Lendingmemo.com (Flickr)