The Financials sector ranks ninth out of the ten sectors as detailed in my Sector Rankings for ETFs and Mutual Funds report. It gets my Dangerous rating, which is based on aggregation of ratings of 46 ETFs and 232 mutual funds in the Financials sector as of July 15, 2014. Prior reports on the best & worst ETFs and mutual funds in every sector are here.
Figures 1 and 2 show the five best and worst-rated ETFs and mutual funds in the sector. Not all Financials sector ETFs and mutual funds are created the same. The number of holdings varies widely (from 21 to 540). This variation creates drastically different investment implications and, therefore, ratings. The best ETFs and mutual funds allocate more value to Attractive-or-better-rated stocks than the worst ETFs and mutual funds, which allocate too much value to Neutral-or-worse-rated stocks.
To identify the best and avoid the worst ETFs and mutual funds within the Financials sector, investors need a predictive rating based on (1) the stocks ratings of the holdings, (2) the all-in expenses of each ETF and mutual fund, and (3) the fund’s rank compared to all other ETFs and mutual funds. As a result, only the cheapest funds with the best holdings receive Attractive or better ratings. Investors need not rely on backward-looking ratings. My fund rating methodology is detailed here.
Investors seeking exposure to the Financials sector should buy one of the Attractive-or-better rated ETFs or mutual funds from Figures 1 and 2.
Get my ratings on all ETFs and mutual funds in this sector on my mutual fund and ETF screener.
Figure 1: ETFs with the Best & Worst Ratings – Top 5
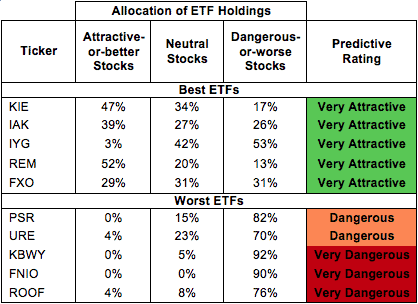
* Best ETFs exclude ETFs with TNAs less than $100 million for inadequate liquidity.
Sources: New Constructs, LLC and company filings
PowerShares KBW Property & Casualty Insurance Portfolio (KBWP) and PowerShares KBW Insurance Portfolio (KBWI) are excluded from Figure 1 because their total net assets (TNA) are below $100 million and do not meet our liquidity minimums.
Figure 2: Mutual Funds with the Best & Worst Ratings – Top 5

* Best mutual funds exclude funds with TNAs less than $100 million for inadequate liquidity.
Sources: New Constructs, LLC and company filings
State Street SPDR KBW Insurance (KIE) is my top-rated Financials ETF and Fidelity Select Consumer Finance Portfolio (FSVLX) is my top-rated Financials mutual fund. Both earn my Very Attractive rating.
IndexIQ US Real Estate Small Cap (ROOF) is my worst-rated Financials ETF and Rydex Series Real Estate Fund (RYREX) is my worst-rated Financials mutual fund. Both earn my Very Dangerous rating.
Figure 3 shows that 81 out of the 590 stocks (over 7% of the market value) in Financials ETFs and mutual funds get an Attractive-or-better rating. However, only 8 out of 46 Financials ETFs (less than 5% of total net assets) and 6 out of 232 Financials mutual funds (less than 2% of total net assets) get an Attractive-or-better rating.
The takeaways are: Mutual fund managers allocate too much capital to low-quality stocks and Financials ETFs hold poor quality stocks.
Figure 3: Financials Sector Landscape For ETFs, Mutual Funds & Stocks
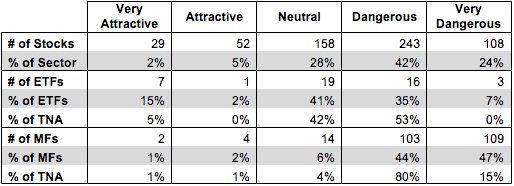
Sources: New Constructs, LLC and company filings
As detailed in “Low-Cost Funds Dupe Investors”, the fund industry offers many cheap funds but very few funds with high-quality stocks, or with what I call good portfolio management.
Investors need to tread carefully when considering Financials ETFs and mutual funds, as there are very few Attractive-or-better rated funds. Only 8 ETFs and 6 Financials mutual funds in the Financials sector allocate enough value to Attractive-or-better-rated stocks to earn an Attractive rating.
OFG Bancorp (OFG) is one of my favorite stocks held by Financials ETFs and mutual funds and earns my Very Attractive rating. Since the financial crisis in 2008, OFG has grown after-tax profit (NOPAT) by 44% compounded annually. OFG has also increased its return on invested capital (ROIC) from 5% in 2008 to 14% in 2013. Despite OFG’s ability to safely weather a drastic downturn in the economy, investors are still valuing OFG as if its profits will decline not grow. At its current price of ~$16/share, OFG has a price to economic book value (PEBV) ratio of 0.7. This ratio implies the market expects OFG’s NOPAT to permanently decline 30% from current levels. This expectation contrasts with the excellent profit growth the company has achieved over the past five years. Low expectations coupled with strong profitability make OFG a stock investors should buy.
United Bankshares, Inc. (UBSI) is one of my least favorite stocks held by Financials ETFs and mutual funds and earns my Very Dangerous rating. UBSI’s NOPAT has declined by 9% compounded annually over the last 5 years and the company’s ROIC has fallen to 7%. The last time the company generated positive economic earnings was in 2006. Given the company’s declining NOPAT and decreasing ROIC, one would expect UBSI’s valuation to imply low expectations for future profit growth. The stock is up over 12% since the end of February and expectations are quite high. To justify its current price of ~$33/share, UBSI would have to grow NOPAT by 13% for the next 31 years. It does not seem likely that a company that has failed to grow NOPAT over the past five years will achieve that kind of sustained growth. Investors should avoid UBSI.
588 stocks of the 3000+ I cover are classified as Financials stocks.
Figures 4 and 5 show the rating landscape of all Financials ETFs and mutual funds.
My Sector Rankings for ETFs and Mutual Funds report ranks all sectors and highlights those that offer the best investments.
Figure 4: Separating the Best ETFs From the Worst ETFs
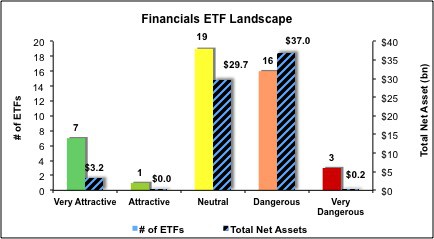
Sources: New Constructs, LLC and company filings
Figure 5: Separating the Best Mutual Funds From the Worst Mutual Funds
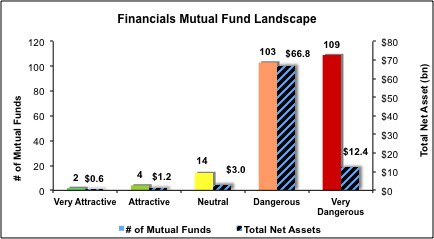
Sources: New Constructs, LLC and company filings
Review my full list of ratings and rankings along with reports on all 46 ETFs and 232 mutual funds in the Financials sector.
Kyle Guske II contributed to this report.
Disclosure: David Trainer and Kyle Guske II receive no compensation to write about any specific stock, sector or theme.