The Large Cap Blend style ranks first out of the twelve fund styles as detailed in my Style Rankings for ETFs and Mutual Funds report. It gets my Attractive rating, which is based on aggregation of ratings of 46 ETFs and 944 mutual funds in the Large Cap Blend style as of July 23, 2014. Prior reports on the best & worst ETFs and mutual funds in every sector and style are here.
Figures 1 and 2 show the five best and worst-rated ETFs and mutual funds in the style. Not all Large Cap Blend style ETFs and mutual funds are created the same. The number of holdings varies widely (from 19 to 1009). This variation creates drastically different investment implications and, therefore, ratings. The best ETFs and mutual funds allocate more value to Attractive-or-better-rated stocks than the worst, which allocate too much value to Neutral-or-worse-rated stocks.
To identify the best and avoid the worst ETFs and mutual funds within the Large Cap Blend sector, investors need a predictive rating based on (1) the stocks ratings of the holdings, (2) the all-in expenses of each ETF and mutual fund, and (3) the fund’s rank compared to all other ETFs and mutual funds. As a result, only the cheapest funds with the best holdings receive Attractive or better ratings. Investors need not rely on backward-looking ratings. My fund rating methodology is detailed here.
Investors seeking exposure to the Large Cap Blend style should buy one of the Attractive-or-better rated ETFs or mutual funds from Figures 1 and 2.
Get my ratings on all ETFs and mutual funds in this style by searching for Large Cap Blend on my free mutual fund and ETF screener.
Figure 1: ETFs with the Best & Worst Ratings – Top 5

* Best ETFs exclude ETFs with TNAs less than $100 million for inadequate liquidity.
Sources: New Constructs, LLC and company filings
Figure 2: Mutual Funds with the Best & Worst Ratings – Top 5
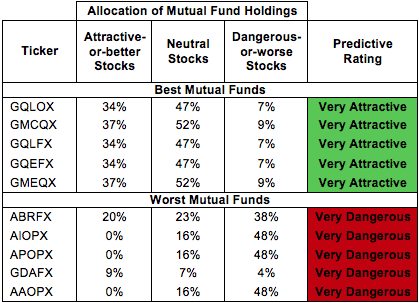
* Best mutual funds exclude funds with TNAs less than $100 million for inadequate liquidity.
Sources: New Constructs, LLC and company filings
Schwab U.S. Dividend Equity ETF(SCHD) is my top-rated Large Cap Blend ETF and GMO Trust: GMO Quality Fund (GQLOX) is my top-rated Large Cap Blend mutual fund. Both earn my Very Attractive rating.
VelocityShares Equal Risk Weighted Large Cap ETF (ERW) is my worst-rated Large Cap Blend ETF and Cavanal Hill Funds: Cavanal Hill Opportunistic Fund (AAOPX) is my worst-rated Large Cap Blend mutual fund. ERW earns my Neutral rating and AAOPX earns my Very Dangerous rating.
Figure 3 shows that 255 out of the 2536 stocks (over 22% of the market value) in Large Cap Blend ETFs and mutual funds get an Attractive-or-better rating. However, 41 out of 46 Large Cap Blend ETFs (97% of total net assets) and 692 out of 944 Large Cap Blend mutual funds (87% of total net assets) get an Attractive-or-better rating.
Figure 3: Large Cap Blend Style Landscape For ETFs, Mutual Funds & Stocks
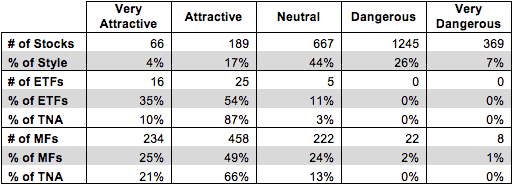
Sources: New Constructs, LLC and company filings
As detailed in “Cheap Funds Dupe Investors”, the fund industry offers many cheap funds but very few funds with high-quality stocks, or with what I call good portfolio management.
Investors need to tread carefully when considering Large Cap Blend ETFs and mutual funds, as there are still dangers within this style. 41 ETFs and 692 mutual funds in the Large Cap Blend style allocate enough value to Attractive-or-better-rated stocks to earn an Attractive rating.
Intel (INTC) is one of my favorite stocks held by Large Cap Blend ETFs and mutual funds and earns my Attractive rating. INTC has grown after-tax profit (NOPAT) by a solid 6% compounded annually for the past decade. Even though last year was a down year for INTC, it still earned a top-quintile return on invested capital (ROIC) of 17%. The stock has been undervalued due to fears about the declining PC market, which called I out as overstated. Recent results have alleviated some fears over the PC market and given INTC a big boost, but the stock remains undervalued. Even if we project just modest NOPAT growth of 5% compounded annually for 15 years, INTC should be worth ~$41/share today, significantly above its current valuation of ~$34/share.
Williams Companies, Inc. (WMB) is one of my least favorite stocks held by Large Cap Blend ETFs and mutual funds and earns my Dangerous rating. Over the last five years WMB’s NOPAT has declined by 9% compounded annually. Over the same time period, the company’s ROIC has fallen from 7% to a bottom quintile 4%. Making matters worse is the fact that WMB hasn’t generated positive economic earnings in any year of my model, which goes back to 1998. Despite the decline in profits, WMB remains priced for significant profit growth. To justify its current price of ~$56/share, WMB must grow NOPAT by 12% compounded annually for the next 41 years. WMB’s declining cash flows combined with its lofty valuation make it a stock to avoid.
Figures 4 and 5 show the rating landscape of all Large Cap Blend ETFs and mutual funds.
My Style Rankings for ETFs and Mutual Funds report ranks all styles and highlights those that offer the best investments.
Figure 4: Separating the Best ETFs From the Worst Funds

Sources: New Constructs, LLC and company filings
Figure 5: Separating the Best Mutual Funds From the Worst Funds
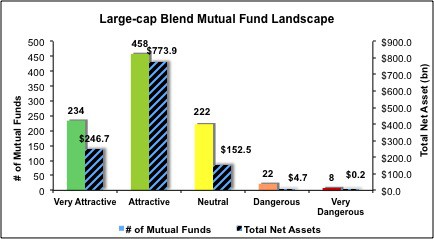
Sources: New Constructs, LLC and company filings
Review my full list of ratings and rankings along with reports on all 46 ETFs and 944 mutual funds in the Large Cap Blend style.
Kyle Guske II contributed to this report.
Disclosure: David Trainer and Kyle Guske II receive no compensation to write about any specific stock, sector, style or theme.