This report identifies the “best” ETFs and mutual funds based on the quality of their holdings and their costs. As detailed in “Low-Cost Funds Dupe Investors”, there are few funds that have both good holdings and low costs. While there are lots of cheap funds, there are very few with high-quality holdings.
Without speculating on the cause for this disconnect, I think it is fair to say that there is a severe lack of quality research into the holdings of mutual funds and ETFs. There should not be such a large gap between the quality of research on stocks and funds, which are simply groups of stocks.
After all, investors should care more about the quality of a fund’s holdings than its costs because the quality of a fund’s holdings is the single most important factor in determining its future performance.
My Predictive Rating system rates 7400+ mutual funds and ETFs according to the quality of their holdings (portfolio management rating) and their costs (total annual costs rating).
The following is a summary of my top picks and pans for all style ETFs and mutual funds. I will follow this summary with a detailed report on each style, just as I did for each sector.
Figure 1 shows the best ETF or mutual fund in each investment style as of January 23, 2014. Investors should focus on all cap value, large cap value, and large cap blend funds as only those styles contain Attractive funds.
For a full list of all ETFs and mutual funds for each investment style ranked from best to worst, see our free ETF and mutual fund screener.
Figure 1: Best ETFs and Mutual Funds In Each Style
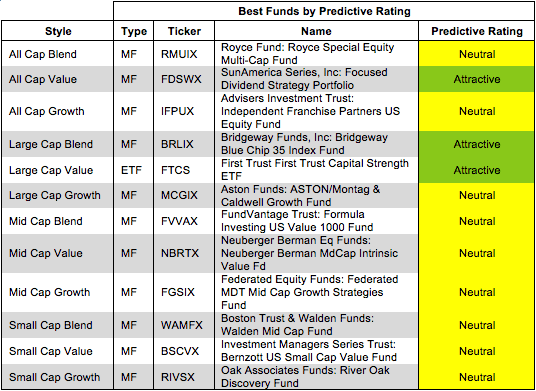 Source: New Constructs, LLC and company filings
First Trust First Trust Capital Strength ETF (FTCS) is my top rated large cap value fund and the number one rated ETF out of all style ETFs and mutual funds I cover. FTCS allocates over 36% of its assets to Attractive-or-better rated stocks. Its total annual costs are 0.72%
Reynolds American, Inc. (RAI) is one of my favorite stocks held by FTCS and earns my Attractive rating. At 11% compounded annually over the past 13 years, RAI’s consistent growth in after tax profit (NOPAT) is impressive. Over the same time, the company has increased their return on invested capital (ROIC) from ~3% to over 9%. RAI has also generated positive and increasing economic earnings since 2005. One might expect a growing company such as RAI to command a high valuation, but that’s not the case here. At its current valuation of ~$49/share, RAI has a price to economic book value (PEBV) ratio of 1.0. This ratio implies that the market expects NOPAT to remain the same or never grow for the remainder of its corporate life. The combination of solid growth and a cheap valuation makes RAI an Attractive stock.
Figure 2 shows the worst ETF or mutual fund for each investment style as of January 23, 2014. Every style has Very Dangerous funds that can hurt investors.
Dangerous-or-worse-rated funds have a combination of low-quality portfolios (i.e. they hold too many Dangerous-or-worse rated stocks) and high costs (they charge investors too much for the [lack of] management they provide).
Figure 2: Worst ETFs and Mutual Funds In Each Style
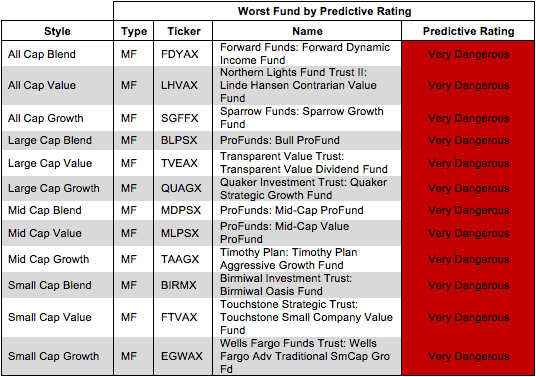 Source: New Constructs, LLC and company filings
ProFunds: Mid-Cap ProFund (MDPSX) is my worst-rated Mid Cap Blend fund and earns my Very Dangerous rating. MDPSX allocates only 3% of its assets to Attractive-or-better rated stock while charging investors total annual costs of 5.15%. To make things worse, MDPSX holds over 56% of its assets in cash. Investors would be better suited to do nothing with their cash and avoid these high fees rather than pay the fund manager to do the same.
Cimarex Energy Company (XEC) is one of my least favorite stocks held my MDPSX and earns my Dangerous rating. Over the past two years XEC’s after-tax profit (NOPAT) has declined by 44% while its return on invested capital (ROIC) has been cut in half, from 11% to 5%. XEC also generated negative free cash flow for the past three years. One would expect such a struggling company to be priced accordingly, but XEC actually has a very expensive valuation. XEC’s valuation of ~$97/share implies that the company will grow NOPAT by 10% compounded annually for 38 years. At that price, XEC carries too much risk with too little potential reward.
Traditional mutual fund research has focused on past performance and low management costs. The quality of a fund’s holdings has been ignored. Our portfolio management rating examines the fund’s holdings in detail and takes into account the fund’s allocation to cash. Our models are created with data from over 40,000 annual reports. This kind of diligence is necessary for understanding just what you are buying when you invest in a mutual fund or an ETF.
Figure 3 shows the best fund based on our Portfolio Management Rating for each investment style as of January 23, 2014. Investors should look to all cap blend and value funds as well as large cap blend and value funds for Attractive rated funds.
Attractive-or-better-rated funds own high-quality stocks and hold very little of the fund’s assets in cash – investors looking to hold cash can do so themselves without paying management fees. Only 0.1% of funds receive our Attractive or Very Attractive ratings, so investors need to be cautious when selecting a mutual fund or ETF – there are thousands of Neutral-or-worse-rated funds.
Figure 3: Style Funds With Highest Quality Holdings
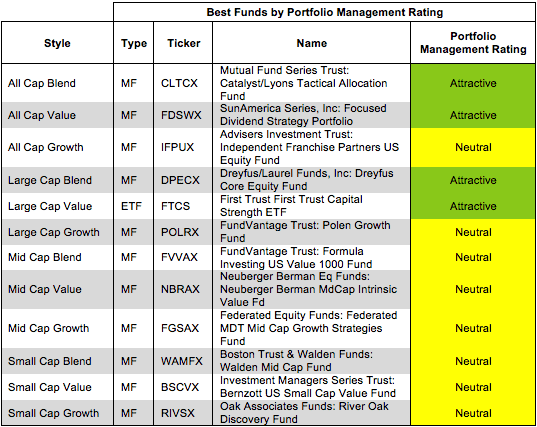 Source: New Constructs, LLC and company filings
Figure 4 shows the worst fund based on our Portfolio Management Rating for each investment style as of January 23, 2014.
Investors pay mutual fund managers to pick stocks for them. Even ignoring costs, these mutual fund managers do a poor job investing money for their clients.
Figure 4: Style Funds With Lowest Quality Holdings
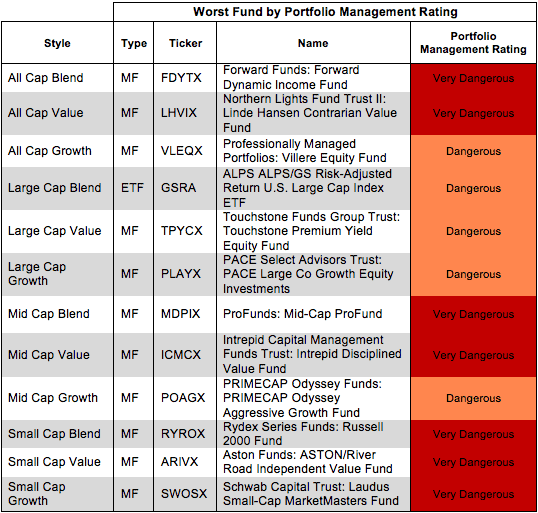 Source: New Constructs, LLC and company filings
Investors should care about all of the fees associated with a fund in addition to the quality of the fund’s holdings. The best funds have both low costs and quality holdings – and there are plenty of low cost funds available to investors.
Figure 5 shows the best fund in each investment style according to our total annual costs rating. An ETF ranks as the lowest cost for seven of the twelve style categories.
Total Annual Costs incorporates all expenses, loads, fees, and transaction costs into a single value that is comparable across all funds. Passively managed ETFs and index mutual funds are generally the cheapest funds.
Figure 5: Style Funds With Lowest Costs
 Source: New Constructs, LLC and company filings
The most expensive fund for each investment style has a Very Dangerous Total Annual Costs Rating. Investors should avoid these funds and other funds with a Very Dangerous Total Annual Costs Ratings because they charge investors too much. For every fund with a Very Dangerous Total Annual Costs Rating there is an alternative fund that offers similar exposure and holdings at a lower cost. We cover over 7000 mutual funds and over 400 ETFs. Investors have plenty of alternatives to these overpriced funds.
Figure 6 shows the worst fund in each investment style according to our total annual costs rating. No ETFs ranks as the most expensive for any style category.
Figure 6: Style Funds With Highest Costs
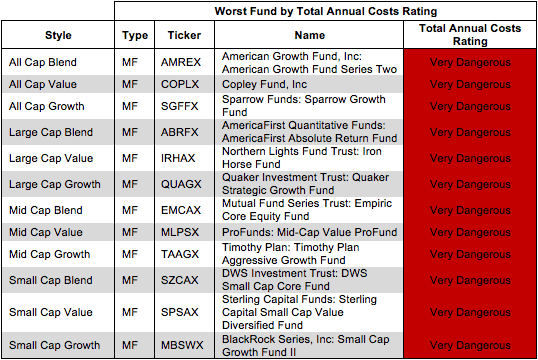 Source: New Constructs, LLC and company filings
Kyle Guske II contributed to this report.
Disclosure: David Trainer and Kyle Guske II receive no compensation to write about any specific stock, sector or theme.