
We published an update on this Danger Zone pick on November 7, 2022. A copy of the associated Earnings Update report is here.
We first put Spotify (SPOT: $107/share) in the Danger Zone in April 2018 prior to its IPO and have reiterated our opinion on the stock numerous times. See all our reports on Spotify here. Since our original report, the stock has outperformed as a short by 86%, falling 35% while the S&P 500 rose 51%. Even with the stock down 54% year-to-date, the company’s current fundamentals cannot justify the expectations baked into its stock price, especially given slowing growth and weak guidance.
This report leverages our cutting-edge Robo-Analyst technology to deliver proven-superior[1] fundamental research and support more cost-effective fulfillment of the fiduciary duty of care.
Spotify’s Stock Could Fall Further Based on:
- slowing growth of premium subscribers
- deteriorating conversion rate of users
- continued cash burn
- margin pressure due to original content spending – à la Netflix
- current valuation of the stock implies Spotify will achieve margins higher than any time in company history and grow premium users to 77% of the entire music streaming subscription market
Figure 1: Danger Zone Outperformance of 86%: From 4/4/18 Through 5/20/22
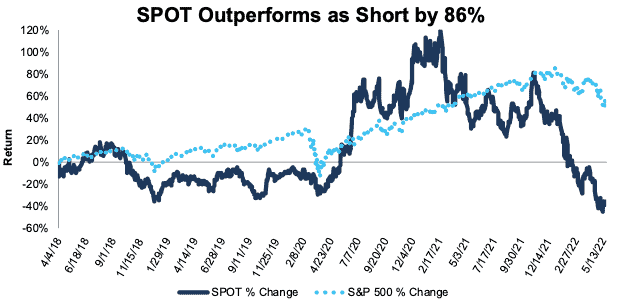
Sources: New Constructs, LLC
What’s Working
Top-Line Metrics Continue to Rise: Spotify grew revenue 24% year-over-year (YoY) in 1Q22 and guided for YoY revenue growth ~20% in 2Q22. Total monthly active users (MAUs) and premium subscribers reached record highs in the quarter as well.
The company continued investing in its podcasting content and increased the number of podcasts on the platform to 4.0 million, which is up from 2.6 million in 1Q21. Spotify noted that podcast consumption rates “grew in the double digits” YoY and “podcast share of overall consumption hours reached an all-time high.”
Unfortunately for Spotify bulls, looking beyond the top-line numbers surfaces some worrying trends about this once high-flying growth story.
What’s Not Working
User Growth Continues to Slow: Spotify’s user numbers, along with its guidance for next quarter came in below consensus estimates. This disappointing performance continues a steady trend of slowing subscriber growth. Per Figure 2, premium subscribers grew just 15% YoY in 1Q22, down from 22% YoY in 1Q21 and 30% YoY in 1Q20. Based on management’s guidance, premium subscribers are expected to grow just 13% YoY in 2Q22, which would be down from 20% YoY in 2Q21.
Figure 2: Year-Over-Year Premium Subscriber Growth Rate: 1Q18 through 2Q22
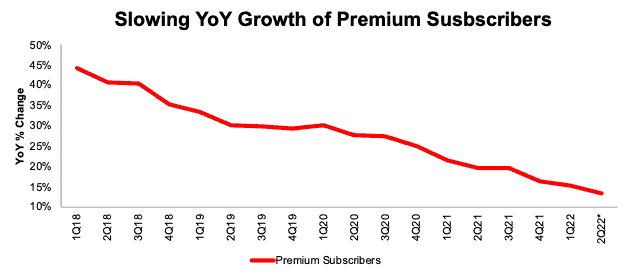
Sources: New Constructs, LLC and company filings
* Based on management’s 2022 guidance
Lower Conversion Rate to Premium: Of course, the name of the game in content distribution is premium payers rather than hangers-on. Here, we find yet more bad news for Spotify investors. The percent of premium subscribers as a percent of MAUs was 43% in 1Q22, down from 44% in 1Q21 and 45% in 1Q20. Spotify is successfully adding users to its service, but its success rate in generating paying users is deteriorating.
Figure 2: Year-Over-Year Premium Subscriber Conversion Rate: 1Q18 through 1Q22
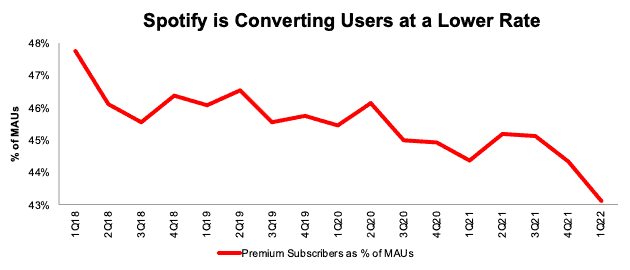
Sources: New Constructs, LLC and company filings
Profitability Is Not Making Up for Slowing Growth
After achieving a positive net operating profit after-tax (NOPAT), NOPAT margin, and return on invested capital (ROIC) on an annual basis for the first time in 2021, Spotify’s business reverted to historical norms in 1Q22. NOPAT margin fell from 0.5% in 1Q21 to -0.1% in 1Q22 and ROIC fell from 4% to -0.5% over the same time.
Management also guided for 2Q22 gross margins to equal 1Q22, which indicates negative NOPAT margins are likely to continue in the upcoming quarter. Performance in 1Q22, along with guidance for 2Q22, provide evidence that the company’s profitability in 2021 was likely an anomaly, rather than a new normal.
Spotify Continues to Burn Cash
From 2017-2021, Spotify burned through a cumulative $884 million in free cash flow (FCF). In 1Q22, Spotify’s FCF was -$442 million, which was worse than the -$160 million in FCF in 1Q21. Over the TTM, Spotify’s FCF sits at -$457 million.
Figure 4: Spotify Cumulative Free Cash Flow: 2017-2021
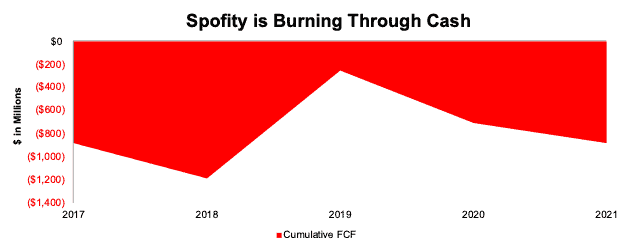
Sources: New Constructs, LLC and company filings
Is Spotify the Next Netflix?
If the trends in Spotify’s business, namely slowing user growth, falling margins, and a plan to expand original content (podcasts) sound familiar, it’s because we’ve seen a similar story play out with Netflix. Details here.
However, Spotify’s CEO Daniel Ek tries avoid such a comparison, perhaps because Netflix is down 69% year-to-date on the back of a big subscriber miss in its most recent quarterly results.
In Spotify’s 1Q22 earnings call, when asked about comparisons to Netflix Mr. Ek noted: “besides both being media companies and being primarily subscription revenue companies, that’s kind of where the similarities end for me.” He continued, “We have hundreds of millions of pieces of content. Netflix makes its own original content solely and licenses a little bit.”
Either Ek is the most unimaginative CEO on the planet, or he is being intentionally obtuse. Spotify is expanding into original content and must pay others for its licensed content (music), which weighs on profitability, all while its user growth is slowing. The Netflix comparison looks apt, especially when one considers Spotify’s biggest competition, Apple Music and Apple Podcasts, is owned by a cash flow machine in Apple (AAPL), just as Netflix’s biggest competitors are cash flow generating businesses such as Disney (DIS) and Warner Bros Discovery (WBD).
Spotify Priced to Have 77% of All Music Streaming Subscribers
We use our reverse discounted cash flow (DCF) model to analyze the future cash flow expectations baked into Spotify’s current valuation. We find that, despite management guiding for slowing premium subscriber growth and flat margins, Spotify is priced as if it will achieve record margins and grow premium subscribers to 77% of the entire subscription market.
To justify its current price of $107/share, Spotify must:
- immediately improve NOPAT margin to 4% (4x its highest ever margin in 2021, which has already declined over the TTM) and
- grow revenue by 15% compounded annually (1.5x projected industry growth through 2027) through 2027.
In this scenario, Spotify’s revenue in 2027 would reach $25.3 billion, or 222% of its TTM revenue. Revenue of $25.3 billion implies Spotify’s premium subscribers increase from 182 million in 1Q22 to 402 million in 2027[2], which equals 77% of global music streaming subscriptions in 2Q21 (most recent data). For reference, MIDiA estimates Spotify held 31% of the global market in 2Q21 (down from 34% in 2Q19), compared to 15% for Apple Music, 13% for Amazon Music, 13% for Tencent Music, and 8% for YouTube Music.
For Spotify to hit such lofty subscriber numbers without taking additional market share, the global market for music streaming business would need to more than double from 529 million streaming subscriptions in 2021 to 1.3 billion in 2027 or about 130 million subscribers per year. For comparison, total global subscriptions grew by just under 110 million from 2020 to 2021.
There’s 43%+ Downside: If we instead assume:
- NOPAT margin improves to 3% over the next four years (3x 2021 margins) and is maintained at 3% from 2025-2027,
- revenue grows at consensus growth rates of 12% in 2022, 16% in 2023, and 13% in 2024, and
- revenue grows 8% a year from 2025-2027, then
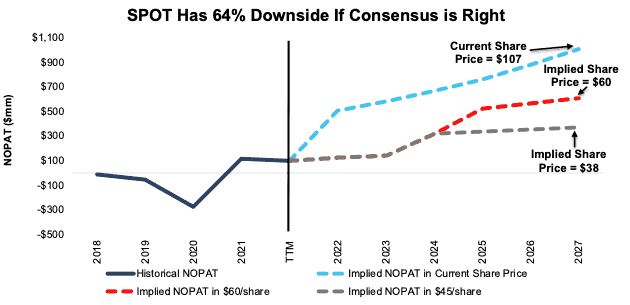
the stock is worth just $60/share today – a 43% downside to the current price.
There’s 64%+ Downside: If we instead assume:
- NOPAT margin improves to 2% over the next four years (double 2021 margins) and is maintained at 2% from 2025-2027,
- revenue grows at consensus growth rates of 12% in 2022, 16% in 2023, and 13% in 2024, and
- revenue grows 5% a year from 2025-2027, then
the stock is worth just $38/share today – a 64% downside to the current price. If Spotify’s growth is slowed by competition, or it fails to improve its margins as podcast/content spending weigh heavily, the downside risk in owning shares is even higher.
Figure 5 compares Spotify’s implied future NOPAT in these scenarios to its historical NOPAT.
Figure 5: Spotify’s Historical and Implied NOPAT: DCF Valuation Scenarios
Sources: New Constructs, LLC and company filings
Each of the above scenarios assumes Spotify’s change in invested capital equals 2% of revenue in each year of our DCF model. For context, Spotify’s change in invested capital is 5% of revenue over the TTM, 3% of revenue in 2021 and 2% of revenue in 2020.
Check out this week’s Danger Zone interview with Chuck Jaffe of Money Life.
This article originally published on May 23, 2022.
Disclosure: David Trainer, Kyle Guske II, and Matt Shuler receive no compensation to write about any specific stock, sector, style, or theme.
Follow us on Twitter, Facebook, LinkedIn, and StockTwits for real-time alerts on all our research.
[1] Our research utilizes our Core Earnings, a more reliable measure of profits, as proven in Core Earnings: New Data & Evidence, written by professors at Harvard Business School (HBS) & MIT Sloan and published in The Journal of Financial Economics.
[2] We calculate the implied number of premium subscribers by dividing implied premium revenue of $21.9 billion, or 87% of implied total revenue (equals Spotify’s premium revenue as % of revenue over the TTM) by $54, which equals Spotify’s TTM revenue per premium user ( TTM premium revenue divided by premium users at the end of 1Q22).