
We closed this position on August 15, 2018. A copy of the associated Position Update report is here.
This firm has proven its ability to succeed in a market where many competitors are fighting for survival. The firm’s efficient distribution of off-price luxury brands to value conscious consumers has proven to be a resilient strategy during the current period of retail disruption. In light of the firm’s improving profitability, surprisingly strong recent growth trends, and undervalued share price, Ross Stores (ROST: $59/share) is this week’s Long Idea.
ROST Consistently Improves Profitability
ROST has grown revenue 9% compounded annually over the past decade. Over the same period, after-tax profit (NOPAT) has increased 16% compounded annually. Per Figure 1, strong profit growth has been fueled by an improvement in NOPAT margin from 5% in 2007 to 10% TTM. Longer-term, ROST has grown NOPAT by 12% compounded annually since 1998.
Figure 1: ROST Profitability Improvement Since 2007
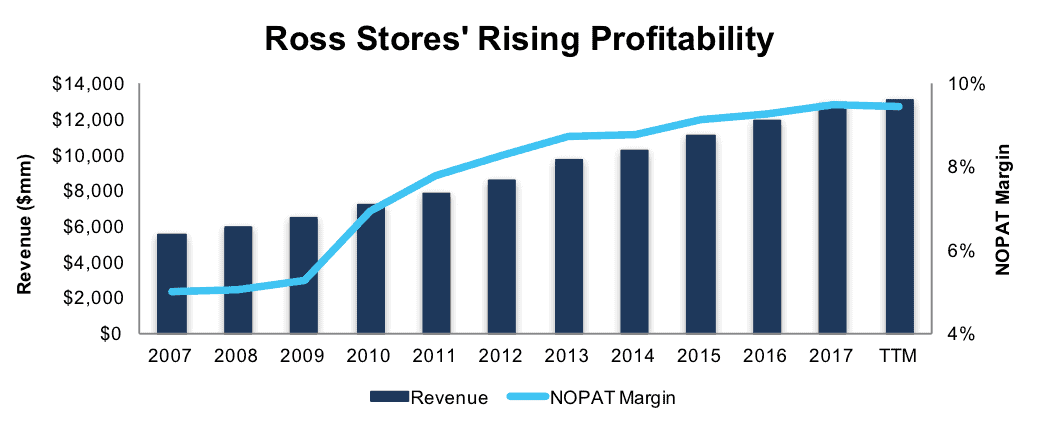
Sources: New Constructs, LLC and company filings
ROST has generated a cumulative $2.7 billion (12% of market cap) of free cash flow (FCF) over the past five years. ROST’s $1.2 billion in FCF over the last twelve months equates to a 5% FCF yield compared to 3% for the average S&P 500 stock.
ROST has also exhibited good stewardship of capital by consistently generating an ROIC above its weighted average cost of capital (WACC). ROST has earned a double digit return on invested capital (ROIC) every year since 1998. Ross currently earns a 21% ROIC, which is in the top-quintile of our coverage universe.
ROST’s balance sheet efficiency is further evidence of good capital stewardship. ROST’s invested capital turns (revenue/average invested capital) have averaged 2.5 over the past decade and currently stand at 2.3 (TTM). This ratio represents a competitive advantage over retail peers who average 1.4 invested capital turns.
Improving ROIC Correlated with Creating Shareholder Value
As noted in our report “5 Unappreciated Stocks with High ROICs”, ROST trades well below where one would expect if the stock were valued in line with the S&P 500. Per Figure 2, ROIC explains 67% of the changes in valuation for the S&P 500. Despite Ross’ 21% ROIC, above the 18% average of the S&P 500, the firm’s stock trades at a discount as shown by its position below the trend line in Figure 2. If the stock were to trade at parity with the market, it would be $68/share – 15% above the current stock price. Given the firm’s rising ROIC and consistent profit growth, one would think the stock would garner a premium valuation.
Figure 2: ROIC Explains 67% Of Valuation for the S&P 500
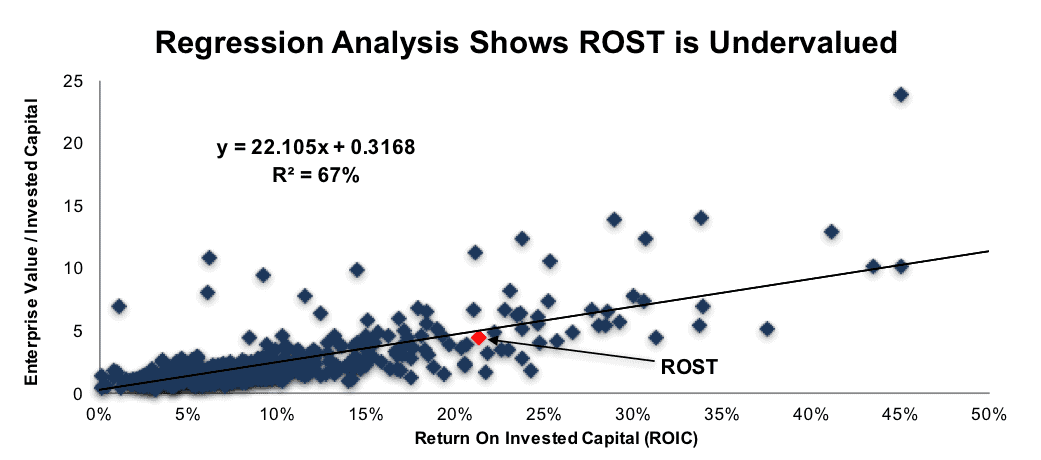
Sources: New Constructs, LLC and company filings
ROST’s Profitability Provides Competitive Advantage
As the largest off-price apparel and home fashion chain in the U.S., ROST faces competition from a litany of fashion retailers. ROST’s biggest competition comes from other off-price retailers such as The TJX Companies (TJX), which operates TJ Maxx and Marshalls, as well as more traditional fashion retailers such as Kohls (KSS), Nordstrom (JWN), Macy’s Inc. (M) Dillard’s (DDS) and J.C. Penney Co. (JCP). Per Figure 3, ROST’s NOPAT margin and ROIC rank well above traditional retailers and its closest competition in TJX.
ROST’s off-price business model provides significant advantages in the cutthroat retail market and insulates the firm from the omnipresent “Amazon threat.” Its lower prices appeal to consumers even in the face of a tough retail environment where most retailers are struggling to maintain sales, much less grow them.
Further, prudent inventory and cost management keeps margins high and provides a competitive advantage in the face of ongoing price wars. ROST has displayed the ability to withstand retail disruption better than other retailers, where razor-thin margins and reliance on fashion trends to drive customer traffic is taking its toll.
Figure 3: Ross’ Profitability Tops Amongst Peers
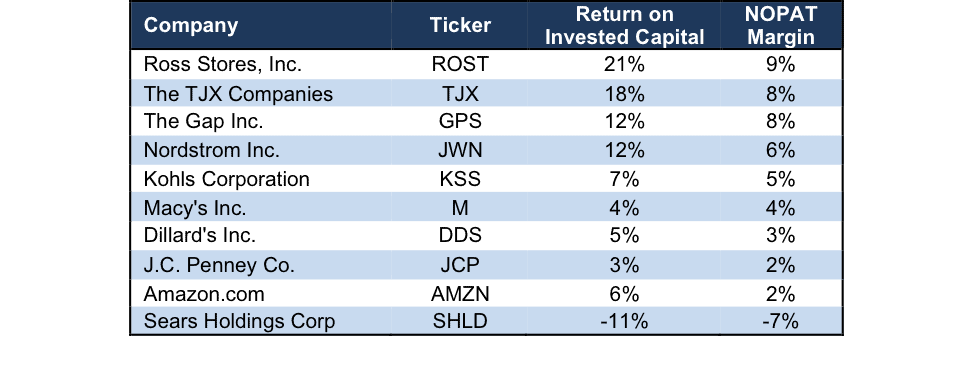
Sources: New Constructs, LLC and company filings.
Bears Assume Off-Price Retail Suffers Same Fate as Department Stores
Over the past few years, traditional retailers have faced declining sales, work force reductions and a large number of store closures. These troubles have been blamed on a weak consumer, poor management, and the growth of e-commerce.
This last shift, or what could otherwise be called the “Amazon effect,” has many investors worried that brick-and-mortar retail is on its death bed. However, off-price retail, particularly ROST, has remained resilient in the face of these challenges. To buy into the bear case around ROST, one must assume that these trends, which have yet to impact ROST, will suddenly become large challenges to growth and margins.
ROST’s business is predicated on buying name-brand apparel and pricing it 20-60% below most department store prices. ROST gets these discounts through large purchases that take advantage of imbalances between demand and supply of apparel. Additionally, Ross does not require contingencies from manufacturers, such as return privileges, split shipments, or promotional allowances, which provide ROST further discounts on purchases.
This business model helps insulate the firm from the e-commerce threat. Rather than providing a standard lineup of goods which can easily be commoditized online, consumers are incentivized to physically visit ROST stores in order to capitalize on low prices not available elsewhere, not even online.
This strategy has led to a highly profitable business model (as shown in Figure 1) that has bucked challenging retail growth trends. Per Figure 4, ROST has generated comparable stores sales growth ranging from 2% to 7% each quarter since 2Q14. Longer-term, ROST has generated positive comparable store sales growth for 34 consecutive quarters. The last time ROST reported negative comparable store sales was 4Q08.
Figure 4: Ross’ Comparable Stores Sales Growth Since 2Q14
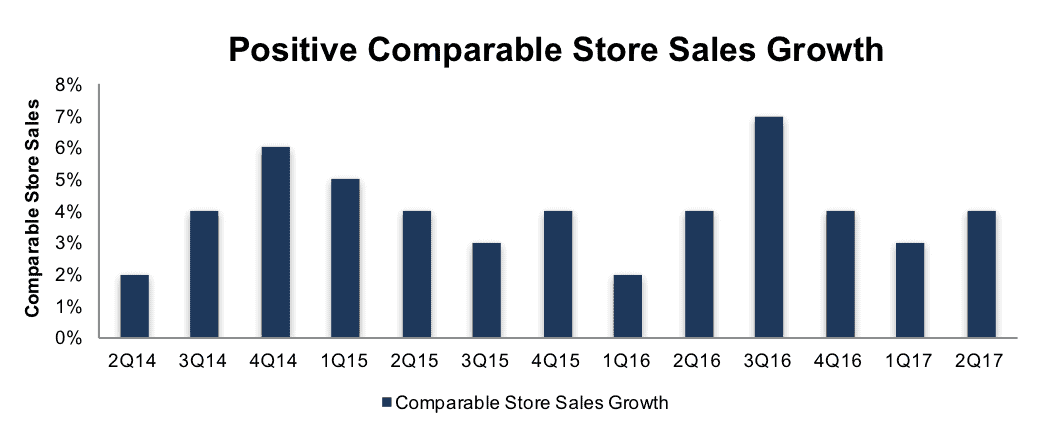
Sources: New Constructs, LLC and company filings
The growth in comparable store sales is a direct result of ROST’s superior value proposition to consumers. Further, prudent cost management has led to the improved margins noted earlier. Per Figure 5, cost of goods sold as a percent of revenue has fallen from 78% in 2007 to 71% in 2017. Meanwhile, Selling, General, and Administrative costs remained at 15% of revenue in both 2007 and 2017. These tight cost controls should allow ROST to continue leveraging comparable stores sales growth into even higher levels of profit growth.
Figure 5: Operating Expenses as a Percent of Revenue

Sources: New Constructs, LLC and company filings
Lastly, ROST’s low valuation undermines many bear arguments. Despite improving profitability and solid comparable stores sales growth, Ross’ current valuation implies meager profit growth, as we’ll show below.
Despite Recent Recovery, ROST Remains Undervalued
Despite rising 10% after strong quarterly earnings, ROST is still down 10% year-to-date while the S&P 500 is up 10%. The disconnect between the fundamentals of the business and its valuation presents a buying opportunity.
At its current price of $59/share, ROST has a price-to-economic book value (PEBV) ratio of 1.1. This ratio means the market expects Ross’ NOPAT to grow by only 10% over the remainder of its corporate life. This expectation seems overly pessimistic for a firm that has grown NOPAT by 16% compounded annually over the past decade and 12% compounded annually since 1998.
If ROST can maintain TTM NOPAT margins (10%) and grow NOPAT by just 5% compounded annually for the next decade, the stock is worth $75/share today – a 27% upside. This scenario assumes ROST can grow revenue by consensus estimates in the current year (8%) and next year (5%), and 5% each year thereafter.
ROST could easily meet or surpass these expectations through continued disciplined product purchasing, inventory management, and new store openings. In fact, revenue has grown by 9% compounded annually over the past decade, well above the expectations in this valuation scenario. Add in the potential 5% yield detailed below, and it’s clear why ROST could be a great portfolio addition.
Share Repurchases Plus Dividends Could Yield Nearly 5%
ROST repurchased $700 million of stock in 2016 and 2015. Through the first six months of 2017, ROST has repurchased $430 million under its current $1.75 billion authorization. ROST management expects to repurchase $875 million in stock during 2017. A repurchase of this size equates to 3.8% of the current market cap. When combined with the 1% dividend yield, the total yield to shareholders could approach 5%.
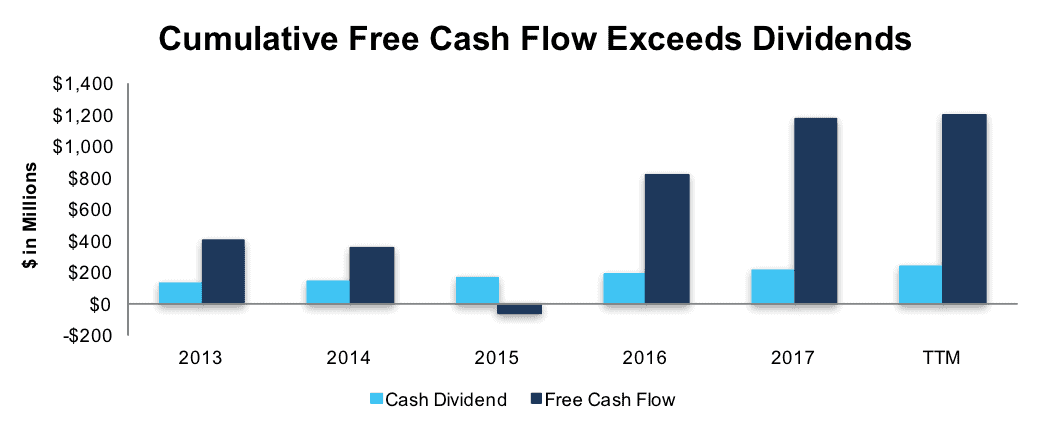
ROST’s current annual dividend of $0.64/share equates to 18% compound annual growth over the past five years. Dividend growth has been enabled by ROST’s free cash flow. Per Figure 6, ROST generated cumulative FCF of $2.7 billion (12% of market cap) and paid out cumulative dividends of $849 million from 2013-2017. This Impressive dividend growth also earned ROST a spot on August’s Dividend Growth Stocks Model Portfolio.
Figure 6: Free Cash Flow vs. Dividends Since Fiscal 2013
Sources: New Constructs, LLC and company filings
Earnings Surprise Could Boost Shares
Despite ROST’s impressive performance over the past year, earnings expectations (as defined by “consensus EPS”) have barely budged from $3.40 to $3.43, or less than 1%. Over the same period, comparable store sales are up 4%, NOPAT (TTM) is up 11% and quarterly earnings have exceeded expectations four times. In addition, management expects comparable store sales growth to increase 1-2% over the second half of 2017.
Negative sentiment and stagnant expectations in the face of better-than-expected earnings creates a situation where an upside surprise sends the shares significantly higher. After recently beating top and bottom line expectations for 2Q17, ROST jumped 10% the following day. ROST remains poised for additional upside surprises given that macro concerns, rather than company specific ones, are driving the low expectations. In the meantime, investors carry low valuation risk and are rewarded with a potential 5% total shareholder yield.
Executive Compensation Plan Could be Improved but Raises No Alarms
ROST’s executive compensation plan, which includes base salary, annual incentives, and long-term incentives, is largely tied to adjusted pre-tax earnings, a non-GAAP metric which excludes stock based compensation. Both annual bonuses and performance shares are tied to the achievement of an adjusted pre-tax earnings target.
We would prefer to see executive compensation tied to ROIC, since there is a strong correlation between improving ROIC and increasing shareholder value. However, ROST’s current exec comp plan, which has remained largely the same since 1982, has not led to executives getting paid while destroying shareholder value. In fact, quite the opposite is true for ROST. Economic earnings, the true cash flows of the business, have grown from $46 million in 1998 to $946 million TTM, or 17% compounded annually.
Insider Trading and Short Interest Trends
There is little insight to be gained from recent insider trading trends. Insiders own <1% of outstanding shares, and insider activity has been minimal over the past 12 months with 593,000 shares purchased and 642,000 shares sold.
Short interest trends are more insightful. There are currently 15.4 million shares sold short equating to 4% of shares outstanding and 5 days to cover. Short interest has nearly doubled since year-end 2016, reflecting the broad negative sentiment towards retail. However, short sellers do recognize the differentiation between ROST and other retailers as shown by the much higher short interest levels in other retail stocks, such as: DDS (39%), JCP (40%), JWN (24%), KSS (20%) and M (12%).
Auditable Impact of Footnotes & Forensic Accounting Adjustments
Our Robo-Analyst technology enables us to perform forensic accounting with scale and provide the research needed to fulfill fiduciary duties. In order to derive the true recurring cash flows, an accurate invested capital, and an accurate shareholder value, we made the following adjustments to Ross Store’s 2017 10-K:
Income Statement: we made $211 million of adjustments, with a net effect of removing $101 million in non-operating expense (1% of revenue). We removed $55 million in non-operating income and $156 million in non-operating expenses. You can see all the adjustments made to ROST’s income statement here.
Balance Sheet: we made $3.3 billion of adjustments to calculate invested capital with a net increase of $2.2 billion. The largest adjustment was $2.8 billion due to off-balance sheet operating leases. This adjustment represented 77% of reported net assets. You can see all the adjustments made to ROST’s balance sheet here.
Valuation: we made $3.9 billion of adjustments with a net effect of decreasing shareholder value by $2.7 billion. Apart from total debt, which includes $2.8 billion in operating leases, the largest adjustment was $591 million in excess cash. This cash adjustment represents 3% of ROST’s market cap. Despite the net decrease in shareholder value, ROST remains undervalued.
Attractive Funds That Hold ROST
The following funds receive our Attractive-or-better rating and allocate significantly to ROST.
- PowerShares Dynamic Retail Portfolio (PMR) – 4.7% allocation and Very Attractive rating.
- PowerShares DWA Consumer Cyclicals Momentum (PEZ) – 4.4% allocation and Very Attractive rating.
- RiverPark/Wedgewood Fund (RWGFX) – 3.6% allocation and Attractive rating.
- Eaton Vance Atlanta Capital Select Equity Fund (ESERX) – 3.1% allocation and Attractive rating.
This article originally published on September 11, 2017.
Disclosure: David Trainer, Kyle Guske II, and Kenneth James receive no compensation to write about any specific stock, style, or theme.
Follow us on Twitter, Facebook, LinkedIn, and StockTwits for real-time alerts on all our research.
Click here to download a PDF of this report.
Photo Credit: Jared Tarbell (flickr)