
The Energy sector ranks eighth out of the ten sectors as detailed in my Sector Rankings for ETFs and Mutual Funds report. It gets my Dangerous rating, which is based on aggregation of ratings of 18 ETFs and 63 mutual funds in the Energy sector as of July 10, 2013. Prior reports on the best & worst ETFs and mutual funds in every sector are here.
Figures 1 and 2 show the five best and worst-rated ETFs and mutual funds in the sector. Not all Energy sector ETFs and mutual funds are created the same. The number of holdings varies widely (from 24 to 168), which creates drastically different investment implications and ratings. The best ETFs and mutual funds allocate more value to Attractive-or-better-rated stocks than the worst ETFs and mutual funds, which allocate too much value to Neutral-or-worse-rated stocks.
To identify the best and avoid the worst ETFs and mutual funds within the Energy sector, investors need a predictive rating based on (1) stocks ratings of the holdings and (2) the all-in expenses of each ETF and mutual fund. Investors need not rely on backward-looking ratings. My fund rating methodology is detailed here.
Investors should not buy any Energy ETFs or mutual funds because none get an Attractive-or-better rating. If you must have exposure to this sector, you should buy a basket of Attractive-or-better rated stocks and avoid paying undeserved fund fees. Active management has a long history of not paying off.
Get my ratings on all ETFs and mutual funds in this sector on my free mutual fund and ETF screener.
Figure 1: ETFs with the Best & Worst Ratings – Top 5
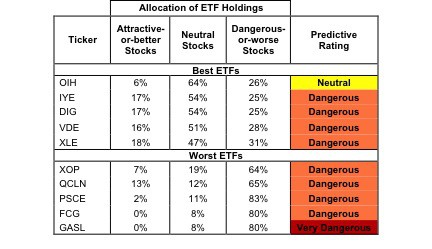 * Best ETFs exclude ETFs with TNAs less than $100 million for inadequate liquidity.
Sources: New Constructs, LLC and company filings
Figure 2: Mutual Funds with the Best & Worst Ratings – Top 5
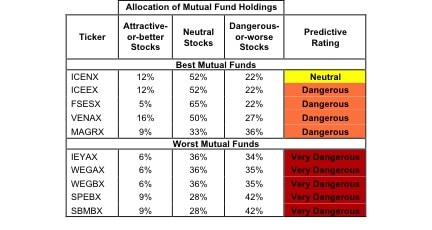
* Best mutual funds exclude funds with TNAs less than $100 million for inadequate liquidity.
Sources: New Constructs, LLC and company filings
Five funds are excluded from Figure 2 because their total net assets (TNA) are below $100 million and do not meet our liquidity standards.
Market Vectors Oil Services ETF (OIH) is my top-rated Energy ETF and ICON Energy Fund (ICENX) is my top-rated Energy mutual fund. Both earn my Neutral rating.
Direxion Daily Natural Gas Related Bull 3x Shares (GASL) is my worst-rated Energy ETF and Saratoga Advantage Trust: Energy and Basic Materials Portfolio (SBMBX) is my worst-rated Energy mutual fund. Both earn my Very Dangerous rating.
Figure 3 shows that 23 out of the 242 stocks (over 14% of the market value) in Energy ETFs and mutual funds get an Attractive-or-better rating. However, none of the 18 ETFs or 63 mutual funds earn an Attractive-or-better rating.
The takeaways are: mutual fund managers allocate too much capital to low-quality stocks and Energy ETFs hold poor quality stocks.
Figure 3: Energy Sector Landscape For ETFs, Mutual Funds & Stocks
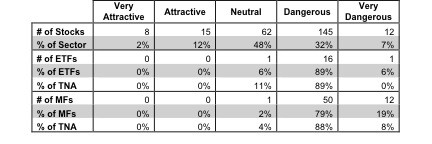
Sources: New Constructs, LLC and company filings
As detailed in “Cheap Funds Dupe Investors”, the fund industry offers many cheap funds but very few funds with high-quality stocks, or with what I call good portfolio management.
Investors need to tread carefully when considering Energy ETFs and mutual funds, as most of them have poor holdings and/or high fees. 17 ETFs (89% of net assets) and 62 mutual funds (96% of assets) in the Energy sector earn a Dangerous-or-worse rating. Investors looking for exposure to the Energy sector would be better off focusing on individual stocks instead.
Marathon Oil (MRO) is one of my favorite stocks held by Energy ETFs and mutual funds and earns my Very Attractive rating. MRO spun off its refining and other downstream segment in 2011 to focus on exploration and development, and the results have been impressive so far. MRO’s after tax profit (NOPAT) margin is up to 25% in 2012 from 6% in 2010. It has increased its return on invested capital (ROIC) to 12%, up from 8% in 2010. MRO has also decreased its total debt and underfunded pension liabilities, helping to bring its weighted average cost of capital (WACC) down from 9% to 8%.
Despite these improvements, MRO is still being valued like its 2010 self. At its current valuation of ~$36.04/share, MRO has a price to economic book value ratio of only 0.6, implying a permanent 40% decline in NOPAT. Expanding margins, declining liabilities, and a cheap valuation make MRO a safe and potentially lucrative investment.
Anadarko Petroleum Corp (APC) is one of my least favorite stocks held by Energy ETFs and mutual funds and earns my Very Dangerous rating. APC has made negative economic earnings in 14 out of the past 15 years. APC’s NOPAT declined by 14% in 2012, causing its ROIC to decline to a mere 5%. APC’s negative free cash flow, $20 billion in total debt, and $8 billion in deferred tax liabilities also raise questions as to whether the company is going to have sufficient funds in the future to maintain capital expenditure.
APC’s fundamentals are poor, but its valuation really drives its Very Dangerous rating. To justify its ~$88.36/share valuation, APC would need to grow NOPAT by 18% compounded annually for eight years. That growth expectation is extremely optimistic for a company selling a commodity product. Investors looking for oil and gas exposure should invest in the cheap and profitable MRO over the expensive and struggling APC.
175 stocks of the 3000+ I cover are classified as Energy stocks, but due to style drift, Energy ETFs and mutual funds hold 242 stocks.
Figures 4 and 5 show the rating landscape of all Energy ETFs and mutual funds.
My Sector Rankings for ETFs and Mutual Funds report ranks all sectors and highlights those that offer the best investments.
Figure 4: Separating the Best ETFs From the Worst ETFs
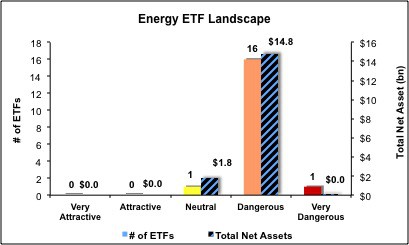
Sources: New Constructs, LLC and company filings
Figure 5: Separating the Best Mutual Funds From the Worst Mutual Funds
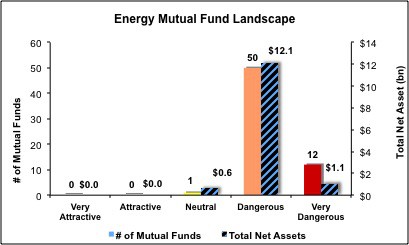
Sources: New Constructs, LLC and company filings
Review my full list of ratings and rankings along with reports on all 18 ETFs and 63 mutual funds in the Energy sector.
Sam McBride contributed to this report.
Disclosure: David Trainer and Sam McBride receive no compensation to write about any specific stock, sector or theme.
2 replies to "Best & Worst ETFs & Mutual Funds: Energy Sector"
There are no clean energy index mutual funds currently available, but recent years have seen a rapid proliferation of new exchange traded funds. At current count, there are four ETFs focusing on clean energy, as well as three sub-sector ETFs for the Solar and Wind sub-sectors.
These two best performing funds for the year have also dropped one notch from their Rank 1 status ( see rankings here ). The fund that declined most in rank was Calvert Global Alternative Energy A (CGAEX), which now rests at a Rank 5. This drop is accredited to shortcomings in the mechanics of the fund, including its high expense ratio relative to the other alternative energy mutual funds, and a low “Alpha” (essentially a measure of the value a fund’s manager brings to the portfolio).