Contrary to nearly every headline you read about monetary policy these days, I believe it is quite possible the Fed Chairmen Ben Bernanke is performing quite well and much better than any of his recent predecessors. In fact, I think he is directing monetary policy with unprecedented precision and skill.
HIDDEN GEM: Our detailed valuation model shows that WDC grew its “economic” profits by 226% while accounting profits grew 194% during its last fiscal year. Economic profits rose by $769mm while accounting profits rose by $912mm.
Today we initiated coverage of ETFs for all major sectors and Indices. Free samples of the initiation reports are here. These reports deliver strategic insights into entire sectors and markets.
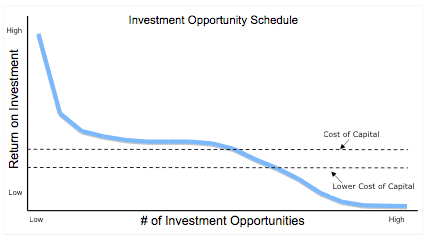
Maintaining artificially low interest rates or excessive money supply does permanent damage to economies in the medium and long-term because it delays creative destruction, the process of replacing low-return investments with higher-return investments. To help illustrate this point, I present the “Investment Opportunity Schedule” in Exhibit 1
RED FLAGS:
1. Misleading Earnings: AKAM reported a $1mm increase in GAAP earnings while our model shows economic earnings declined by $10mm (a difference of $11mm or 7% of reported net income).
2. Very Dangerous Valuation: Stock price of $47 implies AKAM must grow its NOPAT at over 20% com¬pounded annu¬ally for 15 years. A 15-year growth appreciation period with a 20%+ compounding growth rate sets expectations for future cash flow performance quite high.
3. Asset write-offs of $2,000mm or 102% of Net Assets – this means that management has written off at least $1 of assets for every $1 on the current balance sheet. Writing off assets is the opposite of creating shareholder value as it reflects management’s inability to derive any profits for the investments it makes with shareholder funds.
4. Off-balance sheet debt of $128mm or 7% of Net Assets.
5. Outstanding Stock Option Liability of $212mm or 3% of current market value.
The Risk/Reward of the entire S&P 500 gets our Neutral Rating. Our recently published Index Benchmark report on the S&P 500 offers unique insights into the underlying profitability and valuation of all the companies comprised by this index. It also offers benchmarks for (1) investors considering buying ETFs or Index Funds based on the S&P 500 and for (2) comparing individual stocks to the S&P 500.
The Risk/Reward of the entire Russell 2000 gets our Dangerous Rating. Our recently published Index Benchmark report on the Russell 2000 offers unique insights into the underlying profitability and valuation of all the companies comprised by this index. It also offers benchmarks for (1) investors considering buying ETFs or Index Funds based on the Russell 2000 and for (2) comparing individual stocks to the Russell 2000.
HIDDEN GEMS:
1. About $250 million in non-operating expenses (after-tax) cause reported earnings to be understated during the last fiscal year.
2. Our discounted cash flow analysis shows that CL’s current valuation (stock price of $77.52) implies that the company’s profits will decline by 7% and never grow again.
3. The company grew its economic earnings by $229mm (14% increase) during its last fiscal year.
RED FLAGS:
1. Misleading Earnings: RAX reported a $30mm increase in GAAP earnings while our model shows economic earnings declined by $13mm (a difference of $43mm or 7% of revenue).
2. Very Dangerous Valuation: Stock price of $25.636 implies RAX must grow its NOPAT at 25% compounded annually for 17 years. A 17-year Growth Appreciation Period with a 25% compounding growth rate is quite a high standard to beat, as per my post on How To Make Money Picking Stocks.
3. Outstanding Stock Option Liability of $205mm or 6.5% of current market value
MSFT released better than expected earnings and is up 8.3% since it was named the Stock Pick of the Week on October 28, 2010. Overt the same time period, the S&P 500 is up only 3.6%.
The second report in our Red Flag series focuses on a little-known earnings Windfall in the Paper and Products Industry. This report is another example of the deep analysis New Constructs performs on all 3000+ companies under coverage. Our expertise is in navigating poor and confusing disclosure in the Financial Footnotes to find the truth about corporate profitability and valuation.
In another excellent expose "Wall Street Proprietary Trading Under Cover", Michael Lewis exposes Wall Street's plan to exploit loopholes in the laws and regs to continue proprietary trading, the activity that was the primary downfall of Bear Stearns and Lehman Brothers.
HIDDEN GEMS:
1. Our discounted cash flow analysis shows that BMY’s current valuation (stock price of $27.16) implies that the company’s profits will decline by 35% and never grow again.
2. The company grew its economic earnings by $307.5mm (12% increase) during its last fiscal year.
3. The company has $9,507mm in Excess Cash, which we remove from our Invested Capital calculation. $9,507mm million is more than 20% of BMY’s market cap.
HIDDEN GEM: AAPL's economic earnings rose more than its accounting earnings during the last fiscal year. Economic earnings rose by $3,576 while accounting earnings rose by $2,401. And the company has $31,849mm in Excess Cash, a reflection of the strong profitability of the business.
The first in a series of upcoming reports on Red Flags and Hidden Gems, we published our Red Flag Report on Off-Balance Sheet Debt. This report delivers:
1. Measurement of the impact of the operating lease accounting loophole on the entire stock market and all 3000 companies we cover.
2. Explanation of exactly how the off-balance sheet debt from operating leases affect economic earnings.
RED FLAGS:
Misleading Earnings: CBG reported a $1,045mm increase in GAAP earnings while our model shows economic earnings declined by $358mm.
Very Dangerous Valuation: Stock price of $19.06 implies CBG must grow its NOPAT at 20% compounded annually for 15 years. Has any company ever done that, much less a commercial real estate company?
There are many ways to define the quality and merit of equity research. One measure stands tallest: performance of stock recommendations. And by that measure, New Constructs’ research is of very high quality (especially for the price!!).
HIDDEN GEM: GOOG has over $24,100mm in Excess Cash, a reflection of the profitability of the business and a 64% deduction to Reported Net Assets for our Invested Capital calculation.
One of October's Most Attractive Stocks, Seagate Technology PLC (ticker - STX) is up over 15% today. STX was added to our list of Most Attractive Stocks in September, shortly after we reviewed the company's latest 10K and found HIDDEN GEMS.
At a time when most of the public believes political leadership to be weak, we should not focus on finding scapegoats but rather on assuming accountability to help fix problems.