
This report highlights a rare opportunity to compare our research to a competitor’s and show how our proven-superior research[1] provides our clients with insights they cannot get anywhere else.
Specifically, we highlight the differences between our calculations of return on invested capital (ROIC), return on equity (ROE), and overall stock rating compared to Morningstar’s research, as provided in this tweet.
The bottom line: there are very large differences between our research and Morningstar’s. For example:
- Morningstar shows Bristol Myers Squibb’s (BMY) ROIC is -7.18%, and we show 8.3%.
- Morningstar shows Tencent Holdings’ (TCEHY) ROIC is 9.67%, and we show 21.9%.
- Morningstar shows Huntington Ingalls’ (HII) ROIC is 11.67%, and we show 5.9%.
More details in Figure 1.
Figure 1: New Constructs vs. Morningstar ROIC
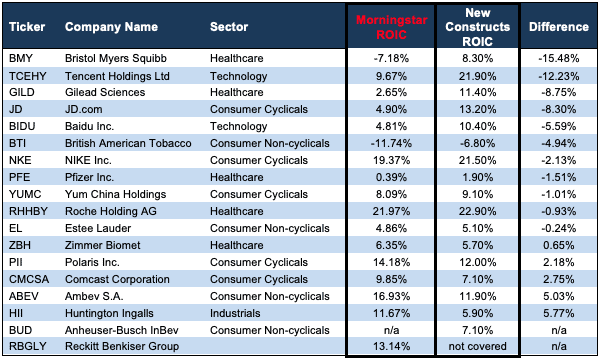
Sources: New Constructs, LLC and Morningstar data from here
We also see very large differences in the ROE values compared to our research. For example:
- Morningstar shows Bristol Myers Squibb’s ROE is -22.11% and we show -37.3%.
- Morningstar shows British American Tobacco’s (BTI) ROE is -21.81% and we show -28.20%.
See Figure 2.
Figure 2: New Constructs vs. Morningstar ROE
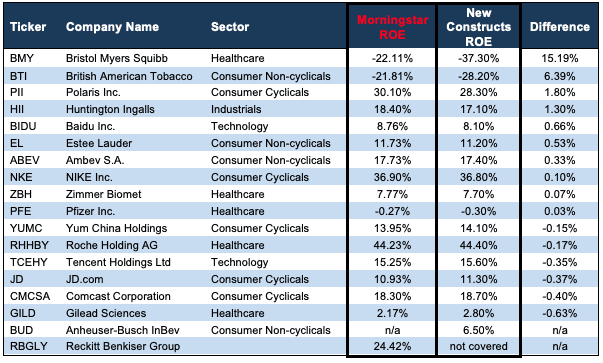
Sources: New Constructs, LLC and Morningstar data from here
Not surprisingly, our Ratings on the stocks are also quite different. Morningstar ratings are much more positive than ours. For example:
- Morningstar gives Pfizer (PFE) a 1 and we give them a 4, or Unattractive rating.
- The same goes for Zimmer Biomet (ZBH), Estee Lauder (EL), Huntington Ingalls, and British American Tobacco.
For reference, 1 is the best rating and 5 is the worst for both firms. See Figure 3.
Figure 3: New Constructs vs. Morningstar Stock Ratings
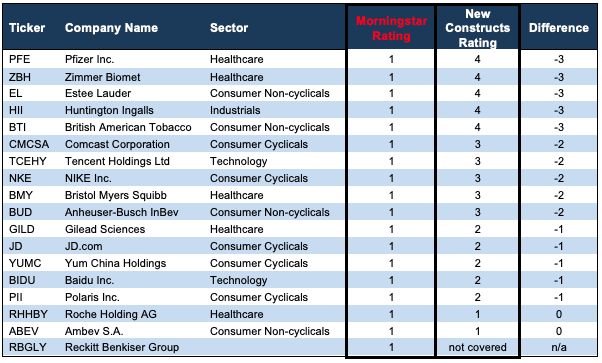
Sources: New Constructs, LLC and Morningstar data from here
This article was originally published on July 16, 2024.
Disclosure: David Trainer, Kyle Guske II, and Hakan Salt receive no compensation to write about any specific stock, style, or theme.
Questions on this report or others? Join our online community and connect with us directly.
[1] The Journal of Financial Economics features the superiority of our Core Earnings in Core Earnings: New Data & Evidence.