Our Stock Rating System
A Detailed Review of How We Rate Stocks
Our Stock Ratings outperform Wall Street analysts’ ratings – as proven by Harvard Business School. Our Stock Ratings get their edge from our more disciplined approach, superior fundamental data and financial models – as proven by The Journal of Financial Economics and Ernst & Young. Our Long Idea and Danger Zone picks are consistently ranked #1 and are regularly featured by all major media outlets.
We assign one of five ratings to every stock under coverage: Very Attractive (best rating), Attractive, Neutral, Unattractive, Very Unattractive (worst rating). The same rating system also applies to ETFs and mutual funds.
Ratings are based on the 5 most important criteria for assessing the risk versus reward of stocks. Those criteria are divided into two categories: “Quality of Earnings” and “Valuation”. Quality of earnings ratings are based on data in the trailing twelve month period from a company's latest 10-Q or 10-K. Valuation ratings are based on a stock's latest closing price.
Figure 1 shows our standard Risk/Reward Rating table for Apple Inc. (AAPL).
Figure 1: Stock Rating Table
![]()
Sources: New Constructs, LLC
A) Quality of Earnings: the quality of the economic earnings of the company and the strength of its business model based on its ROIC.
1. Economic Vs. Reported EPS measures how reported accounting income compares to the economic earnings of the company.
2. Return on Invested Capital (ROIC) measures the aggregate cash on cash returns of the company.
B) Valuation: based on the expectations embedded in stock prices. Investors should buy stocks with low expectations.
1. Free Cash Flow Yield measures the true cash yield of the company.
2. Price to Economic Book Value measures the growth expectations embedded in the stock price.
3. Market-Implied GAP (Growth Appreciation Period) measures the number of years of future profit growth required to justify the current valuation of the stock.
To illustrate New Constructs’ stock ratings in action, below are the explanations behind how stocks make our monthly Most Attractive Stocks and Most Dangerous Stocks lists. For details on the performance of our Most Attractive and Most Dangerous Stocks since 2005, please see Proof Is In Performance.
Stocks make our Most Attractive list because they have:
- High-Quality Earnings based on:
- Returns on Invested Capital that are rising; and
- Economic Earnings/Cash Flows that are positive.
AND
- Cheap Valuations based on:
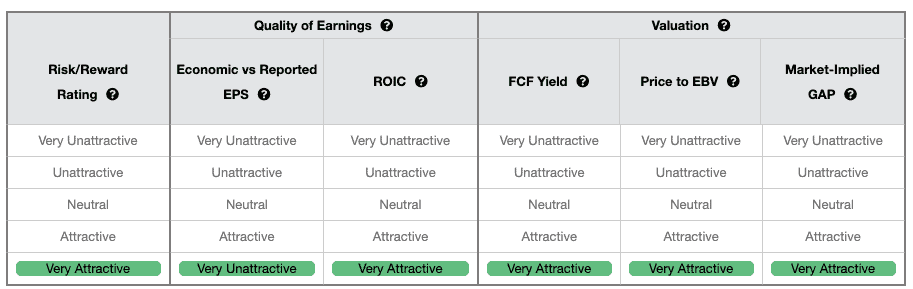
The above characteristics also qualify stocks for a ‘Very Attractive’ or ‘Attractive’ Rating, according to our stock rating system. Figure 2 below shows our stock rating table, which we include in the reports for each of the 3000+ companies that we cover. Stocks get a grade of 1 to 5 for each criterion, 5 being the worst and 1 being the best score. The Overall score is based on the average score of all five criteria. Stocks must get an average score of 1.4 or below to be rated Very Attractive.
For the most part, only Very Attractive stocks qualify for our Most Attractive Stocks lists.
Figure 2: Stock Rating Table for Most Attractive Stocks
Sources: New Constructs, LLC
- Poor-Quality Earnings based on:
- Misleading earnings: rising and positive GAAP earnings while economic earnings are negative and falling; and
- Low Returns on Invested Capital (ROIC).
AND
- Expensive Valuations based on:
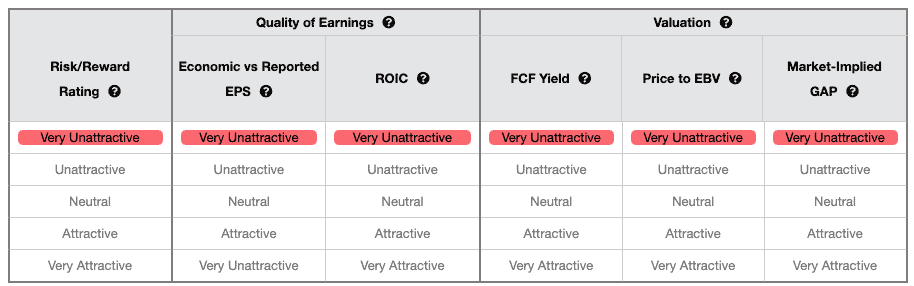
The above characteristics also qualify stocks for a ‘Very Unattractive’ or ‘Unattractive’ Rating, according to our Risk/Reward Rating system. Figure 3 below shows our stock rating table, which we include in the reports for each of the 3000+ companies that we cover. Stocks get a grade of 1 to 5 for each criterion, 5 being the worst and 1 being the best score. The Overall score is based on the average score of all five criteria. Stocks must get an average score of 4.25 or above to be rated Very Unattractive. For the most part, only Very Unattractive stocks qualify for our Most Dangerous Stocks lists.
Figure 3: Stock Rating Table for Most Unattractive Stocks
Sources: New Constructs, LLC
**Deriving economic earnings from accounting data is a difficult and time-consuming task, primarily because it requires analyzing and extracting critical information from the Financial Footnotes. The first step is to create economic financial statements, which are comprised of:
- NOPAT (Net Operating Profit After Tax)
- Invested Capital calculation and definition
- WACC (Weighted-Average Cost of Capital)
Once you have your economic financial statements, then you can derive the economic value drivers that we use to measure the true, underlying profitability of companies.
- ROIC (ROIC stands for Return on Invested Capital)
- Economic Profit/earnings (note EVA is same as Economic Profit)
- Free Cash Flow
- NOPAT Margin
- Invested Capital Turns
FCF Yield Ratings Thresholds Explanation
The thresholds for our FCF Yield Ratings are based on our research that showed stocks for companies with FCF Yields >10% were the strongest performers over the long term. We found that stocks for companies with meaningfully positive FCF Yields performed well albeit not as well as those with >10%. Stocks for companies with FCF Yields that were around 0% did not perform very well (albeit better than those with highly negative FCF Yields).
PEBV Ratio Ratings Thresholds Explanation
The thresholds for our PEBV Ratio Ratings are based on our research that showed stocks for companies with PEBV Ratios between 0 <1.1 were the strongest performers over the long term.
Note that stocks for companies with PEBV Ratios between -1 < 0 tend to perform worse than those with PEBV Ratios <-1 because their companies have more negative NOPATs. These ratings are not as intuitive as some of our other ratings because the PEBV Ratio Rating does not get worse as it becomes a larger negative value. The worst PEBV ratios are between -1 < 0.
Here's the math to explain the non-linear relationship nature of our PEBV Ratio Ratings:
Assume two companies with the same 10% WACC, no assets/liability adjustments, and the same stock price of $10/share. Company A’s NOPAT equals -$50, Company B’s NOPAT is -$1. The economic book value for Company A is -$500 and its PEBV Ratio would be -0.02. The economic book value for Company B is -$10 and its PEBV Ratio would be -1.
Company A, with a more negative NOPAT and worse profitability, has a higher PEBV Ratio than Company B, with less negative NOPAT. The larger the negative NOPAT, the closer the PEBV Ratio gets to zero. On the other hand, the closer NOPAT gets to zero, while still negative, the more negative the PEBV Ratio gets. For a third example, Company C’s NOPAT is -$0.01. Using the same assumptions as we did for Companies A & B, Company C’s PEBV Ratio is -100.
This paper compares our analysis on a mega cap company to other major providers.
Want To Learn More?
Sign up to receive free alerts about all our new research reports including Long Ideas and Danger Zone picks.
See our webinar on importance of ROIC and how to calculate it.
Get our report on "ROIC: The Paradigm For Linking Corporate Performance to Valuation."