
We closed this position on May 17, 2022. A copy of the associated Position Update report is here.
Check out this week’s Danger Zone interview with Chuck Jaffe of Money Life and MarketWatch.com.
State Street Energy Select SPDR (XLE) is up 33% over the past year and investors may be thinking, “now is the right time to invest in the Energy sector.” However, our Sector Ratings for ETF & Mutual Funds show otherwise. In 1Q17, the Energy sector earned a Very Dangerous rating, which is based on an aggregation of ratings of the ETFs and mutual funds in the sector. These ratings are forward-looking and are indicative of how each sector should perform going forward.
Within the sector, Rydex Energy Services Fund (RYESX, RYVCX, RYVAX, RYVIX) stands out as being particularly bad. Despite its own recent run of strong price performance, this fund receives our Very Dangerous rating. Its high fees, exorbitant turnover, and overvalued holdings land it in the Danger Zone this week.
Expense Ratios Are Misleading: This Fund Is More Expensive Than It Seems
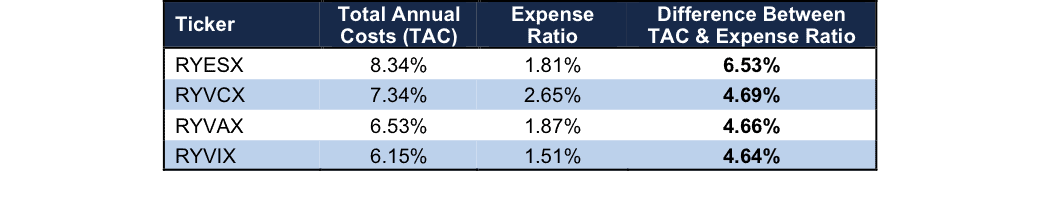
Per Figure 1, Rydex Energy Services Fund’s expense ratios greatly understate the true costs of investing in this fund. With total annual costs (TAC) of 8.34%, RYESX is the most expensive mutual fund in the Energy sector and seventh most expensive fund out of 7000+ mutual funds under coverage.
For comparison, the average TAC of the 116 Energy mutual funds under coverage is 2.65% and the weighted average is lower at 2.08%. The benchmark, State Street Energy Select Sector SPDR (XLE), charges total annual costs of just 0.15%.
Figure 1: Rydex Energy Services Fund’s Understated Costs
Sources: New Constructs, LLC and company filings
To justify its higher fees, the Rydex Energy Services Fund must outperform XLE by the following over three years:
- RYESX must outperform by 8.17% annually.
- RYVCX must outperform by 7.18% annually.
- RYVAX must outperform by 6.37% annually.
- RYVIX must outperform by 5.99% annually.
An in-depth analysis of Rydex Energy Services Fund’s TAC is on page 2 here.
Nosebleed Transaction Costs Make Good Performance Nearly Impossible
The only justification for mutual funds to have higher fees than ETFs is “active” management that leads to out-performance. How can a fund that is constantly trading in/out of losing positions, and in turn racking up large transaction costs, hope to outperform?
We include transaction costs in our total annual costs (TAC) calculation so investors know the true, full cost of funds. Rydex Energy Services Fund’s annual turnover is an astounding 1241%, which translates into an annual cost of 4.73%. No matter the investment strategy, such high trading costs consistently eat away at any potential returns for investors.
Worse yet, Rydex Energy Services Fund investors are paying these fees for significantly overvalued stocks, as we’ll show below.
RYESX Allocates To Dangerous Stocks
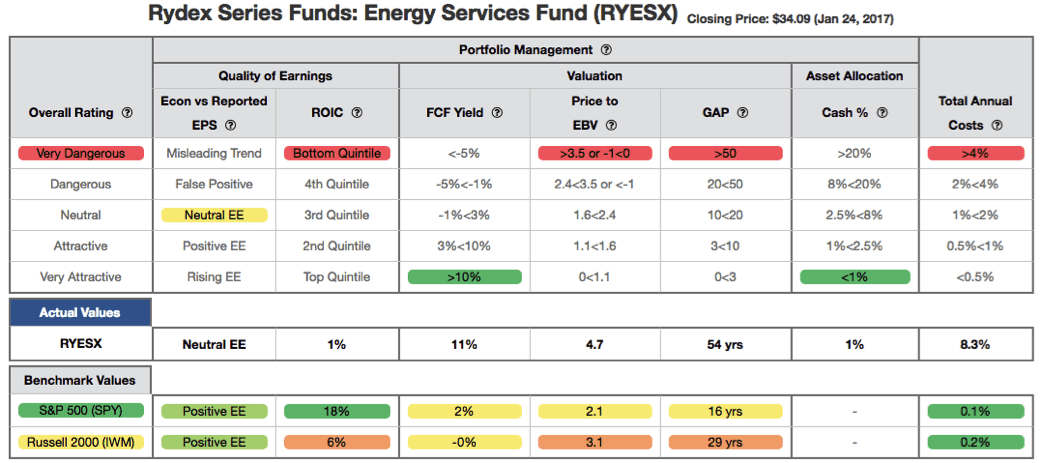
In Figure 2, the details behind our Predictive Overall Fund Rating for RYESX show the managers of the fund have not selected good stocks in terms of earnings quality and valuation.
Figure 2: Rydex Energy Services Fund (RYESX) Rating Breakdown
Sources: New Constructs, LLC and company filings
The findings from our discounted cash flow valuation of the fund reveal the market implied growth appreciation period (GAP) is 36 years for the State Street Energy Select SPDR (XLE) and 16 years for the S&P 500 – compared to 54 years for RYESX.
This high valuation of the fund’s holdings is more troublesome considering the return on invested capital (ROIC) of the S&P is 18% compared to 1% for the Rydex Energy Services Fund. In other words, despite being less profitable, the market expects the stocks held by RYESX to grow economic earnings for nearly four decades longer than those held by the S&P 500.
Lastly, the price-to-economic book value (PEBV) ratio for the S&P 500, which includes some of the world’s most successful companies, is 2.1. The PEBV ratio for RYESX is 4.7. This ratio means that the market expects the profits for the S&P 500 to increase 210% from their current levels versus 470% for RYESX.
At the end of the day, the high profit growth expectations baked into the valuations of stocks held by Rydex Energy Services Fund lowers the upside potential and makes outperformance moving forward less likely.
Recent Outperformance Is The Exception Not the Rule
Over the past year, RYESX is up 46% while XLE is up 33%. Given that 75% of assets are allocated to stocks with Dangerous-or-worse ratings, the recent price performance is more likely a peak rather than the beginning of long-term outperformance.
Investors looking to buy RYESX must not only expect the significant profit growth highlighted earlier, but also ignore the fund’s history of underperformance. Over the past decade, RYESX is down 18%, RYVCX is down 24%, RYVIX is down 16%, and RYVAX is down 20%. Meanwhile, XLE is up 32% over the same time. Figure 3 shows the growth of 10k over the past decade for each share class of Rydex Energy Services Fund.
We think it overly optimistic to invest in the belief that these mutual funds will ever outperform their much cheaper ETF benchmark over significant time frames given the issues outlined above.
Figure 3: Rydex Energy Services Fund Vs. XLE: Growth of 10K

Sources: New Constructs, LLC and company filings.
The Importance of Holdings Based Fund Analysis
The analysis above shows that investors might want to withdraw most or all of the $44 million in the Rydex Energy Services Fund and put the money into better investments. There are no funds that get an Attractive-or-better rating within the Energy sector. If you must have exposure to this sector, you should buy a basket of Attractive-or-better rated stocks and avoid paying undeserved fund fees.
This article originally published here on January 30, 2017.
Disclosure: David Trainer, Kyle Guske II, and Kyle Martone receive no compensation to write about any specific stock, sector, style, or theme.
Scottrade clients get a Free Gold Membership ($588/yr value) as well as 50% discounts and up to 20 free trades ($140 value) for signing up to Platinum, Pro or Unlimited memberships. Login or open your Scottrade account & find us under Quotes & Research/Investor Tools.
Click here to download a PDF of this report.
Photo Credit: Ed Schipul (Flickr)