For the week of 1/27/20-1/31/20, we focus on the Earnings Distortion scores for 127 companies.
We measure earnings distortion using a proprietary human-assisted ML methodology featured in a recent paper from Harvard Business School (HBS) and MIT Sloan. This paper empirically shows that street earnings estimates are incomplete and less accurate since they do not consistently and accurately adjust for unusual gains/losses buried in footnotes.
As corporate managers bury key data in footnotes to manipulate earnings, and investors miss them, investment opportunities arise because stock prices tend to be driven by core earnings power.
Our Earnings Distortion Scores[1] empower investors to combat management efforts to obfuscate financial performance. The aggregate level of distortion recently reached levels not seen since right before the tech bubble and the financial crisis.
Weekly Earnings Distortion Insights
Figure 1 contains the 15 largest S&P 500 companies, plus those with market caps greater than $10 billion, that we expect to beat or miss earnings expectations the week of January 27, 2020.
Figure 1: Earnings Distortion Scorecard Highlights: Week of 1/27/20-1/31/20
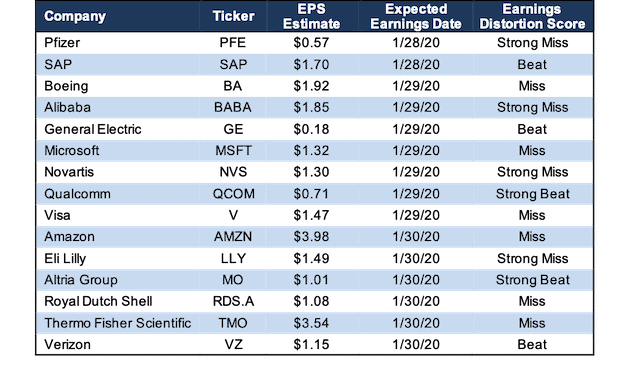
Sources: New Constructs, LLC and company filings
The appendix to this report shows all the S&P 500 companies, plus those with market caps greater than $10 billion, that report earnings the week of January 27, 2020.
Details: QCOM’s Earnings Distortion
In 2019, Qualcomm (QCOM) had $2.7 billion in net earnings distortion that cause earnings to be understated. Notable unusual expenses buried in the fine print of the firm’s 2019 10-K include:
- $2.5 billion in non-recurring tax charges – Page 94
- $203 million in asset impairment charges – Page 75
- $135 million in investment impairment charges – Page 45
We previously featured QCOM as a Long Idea on October 16, 2019 in our article “Novel Dataset Reveals Undervalued Tech Giant.” We showed at the time that the company’s earnings were significantly understated and projected that it would beat expectations when it reported earnings in November.
Sure enough, QCOM had a strong earnings beat in Q4, and the stock is up 13% since our article vs. 9% for the S&P 500.
Now, after analyzing the company’s 2019 10-K, we find that its earnings are still understated. In total, we identified $2.23/share (62% of reported EPS) in net unusual expenses in QCOM’s 2019 results. After removing this earnings distortion from GAAP net income, we see that QCOM’s 2019 core earnings of $5.83/share are significantly above its GAAP EPS of $3.60.
The analyst consensus for QCOM’s Q1 2020 earnings is $0.71/share, which comes out to $2.84/share on an annualized basis. Based on GAAP earnings, current analysts’ estimates imply a decline of 21% in annualized earnings. Figure 2 shows that, after removing earnings distortion, consensus estimates imply a much more significant decline of 51%.
Figure 2: QCOM Core Earnings Vs. GAAP: 2016-Q1 2020
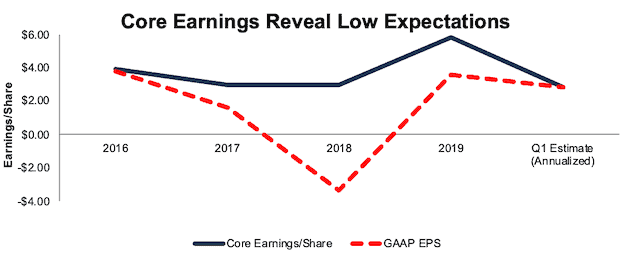
Sources: New Constructs, LLC and company filings
Figure 1 shows that QCOM is one of two companies that earn our “Strong Beat” rating. Three companies earn a “Beat” rating, which means we expect them to beat earnings, but we’re not as confident as we are for QCOM. Six companies in Figure 1 earn a “Miss” rating, and four companies earn a “Strong Miss” rating.
How to Make Money with Earnings Distortion Data
“Trading strategies that exploit {adjustments provided by New Constructs} produce abnormal returns of 7-to-10% per year.” – Page 1 in Core Earnings: New Data & Evidence
In Section 4.3 of Core Earnings: New Data and Evidence, professors from HBS & MIT Sloan present a long/short strategy that holds the stocks with the most understated EPS and shorts the stocks with the most overstated earnings. Positions are opened in the month each 10-K is filed and held until the next 10-K is filed, or about a year.
This simple, low turnover strategy produced abnormal returns of 7-to-10% a year. These abnormal returns show that the market misses important data in the footnotes and that investors who adjust for unusual items can make more money. Click here for more details on our data offerings.
For more on how to use core earnings and earnings distortion to pick better stocks, click here.
This article originally published on January 20, 2020.
Disclosure: David Trainer, Kyle Guske II, and Sam McBride receive no compensation to write about any specific stock, sector, style, or theme.
Follow us on Twitter, Facebook, LinkedIn, and StockTwits for real-time alerts on all our research.
Appendix: All Major Companies That Report January 27-31
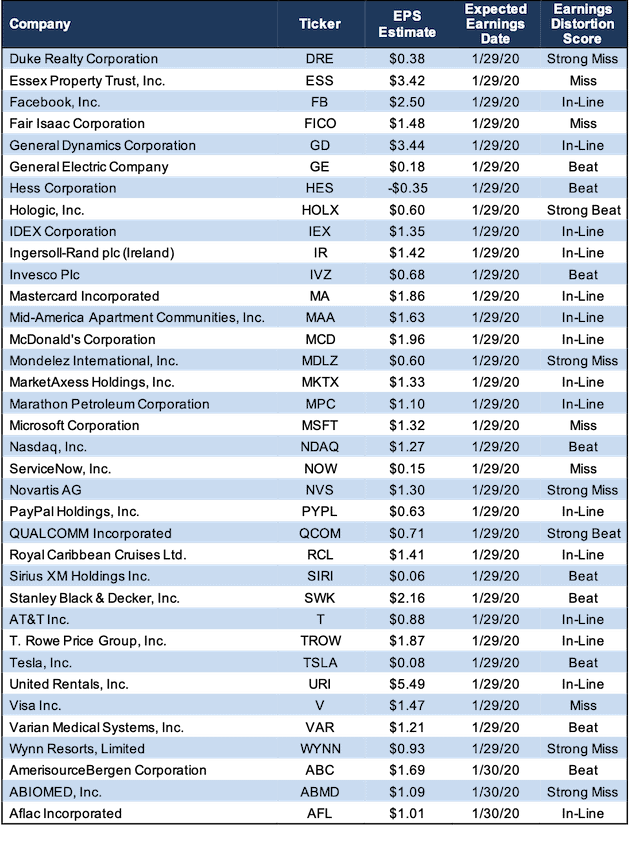
Figure 3 shows all the S&P 500 companies, plus those with market caps greater than $10 billion, that report earnings the week of January 27, 2020.
Figure 3: Earnings Distortion Scorecard: Week of 1/27/20-1/31/20
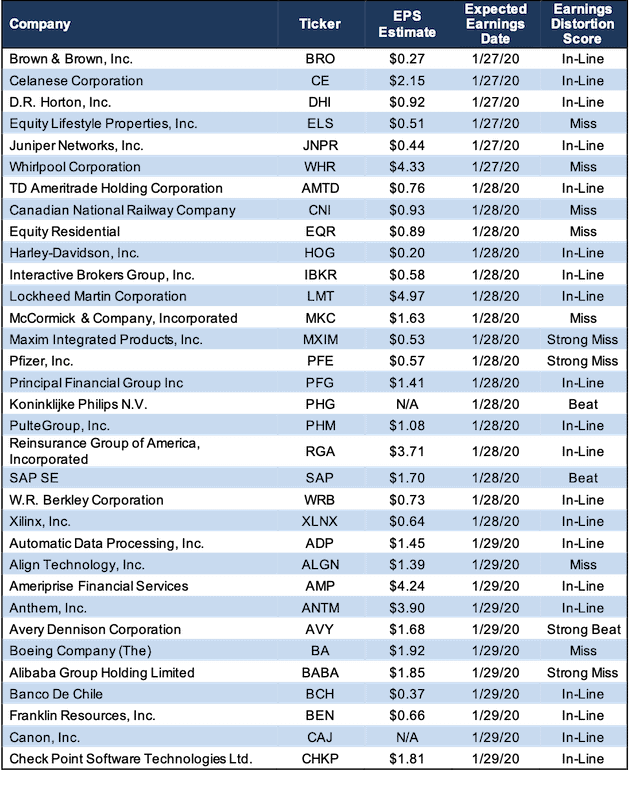
Sources: New Constructs, LLC and company filings
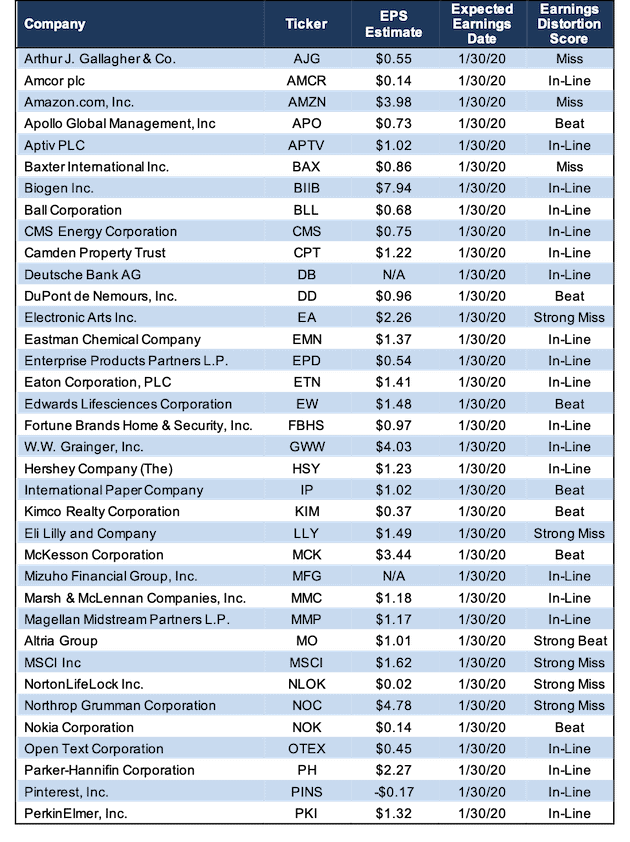
Figure 3: Earnings Distortion Scorecard: Week of 1/27/20-1/31/20 (continued)
Sources: New Constructs, LLC and company filings
Figure 3: Earnings Distortion Scorecard: Week of 1/27/20-1/31/20 (continued)
Sources: New Constructs, LLC and company filings
Figure 3: Earnings Distortion Scorecard: Week of 1/27/20-1/31/20 (continued)
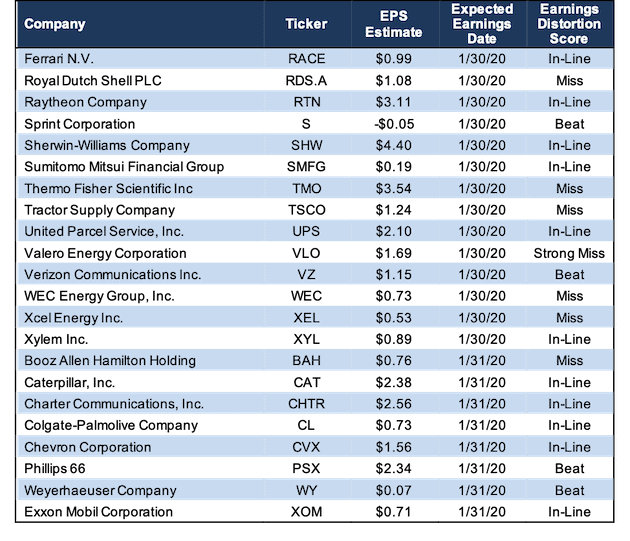
Sources: New Constructs, LLC and company filings
[1] Note that Earnings Distortion scores will be added to our website via a new column on the Screeners and Portfolios page in January 2020.