Recap from December’s Picks
Our Most Attractive Stocks (+3.5%) outperformed the S&P 500 (+3.2%) last month. Most Attractive Large Cap stock YY Inc. (YY) gained 18%. Most Attractive Small Cap stock NVE Corporation (NVEC) was up 16%. Overall, 23 out of the 40 Most Attractive stocks outperformed the S&P 500 in December, and 31 had positive returns.
Our Most Dangerous Stocks (+2.9%) outperformed the S&P 500 (+3.2%) as a short portfolio last month. Most Dangerous Large Cap stock Prestige Brand Holdings (PBH) fell by 7% and Most Dangerous Small Cap stock Republic First Bancorp Inc. (FRBK) fell by 10%. Overall, 22 out of the 40 Most Dangerous stocks outperformed the S&P 500 as a short portfolio in December.
The successes of these model portfolios highlight the value of our machine learning and AI Robo-Analyst technology, which helps clients fulfill the fiduciary duty of care and make smarter investments[1].
11 new stocks make our Most Attractive list this month and nine new stocks fall onto the Most Dangerous list. January’s Most Attractive and Most Dangerous stocks were made available to members on January 5, 2018.
Our Most Attractive stocks have high and rising returns on invested capital (ROIC) and low price to economic book value ratios. Most Dangerous stocks have misleading earnings and long growth appreciation periods implied by their market valuations.
Most Attractive Stocks Feature for January: F5 Networks (FFIV: $138/share)
F5 Networks (FFIV), supplier of networking equipment and software, is the featured stock from January’s Most Attractive Stocks Model Portfolio. FFIV was a featured Long Idea in October 2017 and is up 18% while the S&P is up 7%. Even after outperforming the market, FFIV remains undervalued and is also on our Focus List – Long Model Portfolio.
FFIV’s revenue has grown 15% compounded annually over the past decade while its after-tax profit (NOPAT) has grown 19% compounded annually. FFIV’s NOPAT margin has increased from 14% in 2007 to 20% in 2017. The company also improved its return on invested capital (ROIC) from an already impressive 23% in 2007 to a top-quintile 79% in 2017.
Figure 1: FFIV’s Revenue and Profit Growth Since 2007
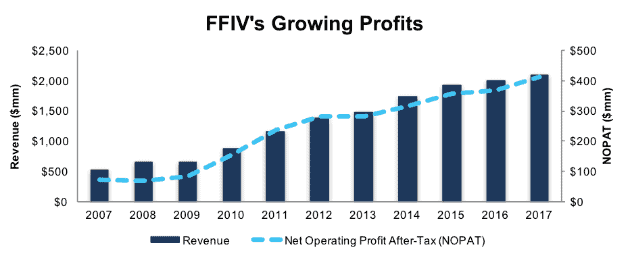
Sources: New Constructs, LLC and company filings
FFIV Has Upside Potential
At its current price of $138/share, FFIV has a price-to-economic book value (PEBV) ratio of 1.2. This ratio means the market expects FFIV’s NOPAT to grow only 20% over the remaining life of the firm. Such an expectation seems pessimistic for a firm that has grown NOPAT by 15% compounded annually over the past decade.
If FFIV can maintain 2017 NOPAT margins of 20% and grow NOPAT by just 5% compounded annually for the next decade, the stock is worth $169/share – a 23% upside.
Auditable Impact of Footnotes and Forensic Accounting Adjustments
Our Robo-Analyst technology enables us to perform forensic accounting with scale and provide the research needed to fulfill fiduciary duties. In order to derive the true recurring cash flows, an accurate invested capital, and an accurate shareholder value, we made the following adjustments to F5 Networks’ 2017 10-K:
Income Statement: we made $67 million of adjustments, with a net effect of removing $7 million in non-operating income (<1% of revenue). We removed $37 million in non-operating income and $30 million in non-operating expenses. You can see all the adjustments made to FFIV’s income statement here.
Balance Sheet: we made $1.8 billion of adjustments to calculate invested capital with a net decrease of $1 billion. One of the largest adjustments was $329 million due to operating leases. This adjustment represented 21% of reported net assets. You can see all the adjustments made to FFIV’s balance sheet here.
Valuation: we made $1.6 billion of adjustments with a net effect of increasing shareholder value by $931 million. The largest adjustment to shareholder value was $1.3 billion in excess cash. This adjustment represents 15% of FFIV’s market cap.
Most Dangerous Stocks Feature: Flowserve Corporation (FLS: $44/share)
Flowserve Corporation (FLS), manufacturer of industrial flow management equipment, is the featured stock from January’s Most Dangerous Stocks Model Portfolio.
Since 2011, FLS’ revenue has fallen 2% compounded annually while NOPAT has fallen 13% compounded annually. The firm’s NOPAT margin declined from 11% in 2011 to 6% TTM while its ROIC fell from 15% to 5%.
Figure 2: Flowserve’s NOPAT Since 2011
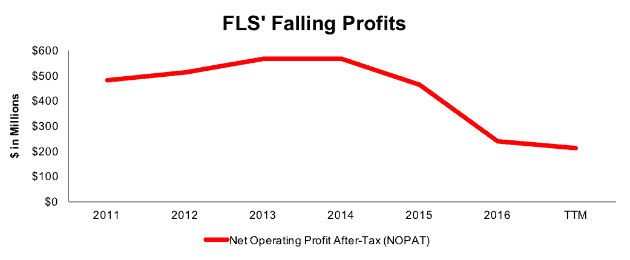
Sources: New Constructs, LLC and company filings
FLS Provides Poor Risk/Reward Tradeoff
FLS is down 10% over the past year while the S&P is up over 21%. Despite underperforming the market, FLS is still overvalued as the valuation of the shares present significant downside risk.
To justify its current price of $44/share, FLS must maintain TTM margins (6%) and grow NOPAT by 8% compounded annually for the next 14 years. This expectation seems overly optimistic given FLS’ NOPAT and NOPAT margin decline over the past five years.
Even if FLS can reverse years of margin decline, maintain TTM margins, and grow NOPAT by 4% compounded annually for the next decade, the stock is worth just $22/share today – a 50% downside.
Auditable Impact of Footnotes and Forensic Accounting Adjustments
Our Robo-Analyst technology enables us to perform forensic accounting with scale and provide the research needed to fulfill fiduciary duties. In order to derive the true recurring cash flows, an accurate invested capital, and an accurate shareholder value, we made the following adjustments to Flowserve’s 2016 10-K:
Income Statement: we made $292 million of adjustments, with a net effect of removing $108 million in non-operating expense (3% of revenue). We removed $92 million in non-operating income and $200 in non-operating expenses. You can see all the adjustments made to FLS’ income statement here.
Balance Sheet: we made $2.6 billion of adjustments to calculate invested capital with a net increase of $865 million. One of the largest adjustments was $1.9 billion due to other comprehensive income. This adjustment represented 53% of reported net assets. You can see all the adjustments made to FLS’ balance sheet here.
Valuation: we made $2.3 billion of adjustments with a net effect of decreasing shareholder value by $1.7 billion. Apart from $1.8 billion in total debt, which includes $186 million in operating leases, the largest adjustment to shareholder value was $219 million in underfunded pensions. This adjustment represents 4% of FLS’ market cap.
This article originally published on January 10, 2018.
Disclosure: David Trainer, Kyle Guske II, and Peter Apockotos receive no compensation to write about any specific stock, style, or theme.
Follow us on Twitter, Facebook, LinkedIn, and StockTwits for real-time alerts on all our research.
[1] Ernst & Young’s recent white paper “Getting ROIC Right” proves the superiority of our holdings research and analytics.