
Check out this week’s Danger Zone interview with Chuck Jaffe of Money Life.
Reported earnings grew at a rapid 23% rate in 2018, but deeper research shows that growth continues to be an illusion. When we remove the impact of the corporate tax cut, economic earnings declined 2%.
This decline in economic earnings, combined with macroeconomic headwinds, suggests that real growth will be hard to find. The disconnect between declining real economic earnings and rising equity markets leads us to put growth investors – who chase misleading earnings growth in companies like United Technologies (UTX) – in the Danger Zone.
Economic Earnings Declined After Stripping Out the Impact of Tax Cuts
As we’ve shown in previous reports, economic earnings – which reverse accounting distortions and account for the weighted average cost of capital (WACC) – across the broader market have been in a steady decline for several years. Economic earnings declined by 28% in 2015, 15% in 2016, and 2% in 2017. At first glance, it would appear that economic earnings rebounded and grew by 18% last year.
However, Figure 1 shows that the entirety of economic earnings growth in 2018 can be attributed to the corporate tax rate cut. If we remove the impact of the tax cut,[1] we see that economic earnings declined by 2% in 2018, same as 2017.
Figure 1: Economic Earnings vs. Tax Neutral Economic Earnings
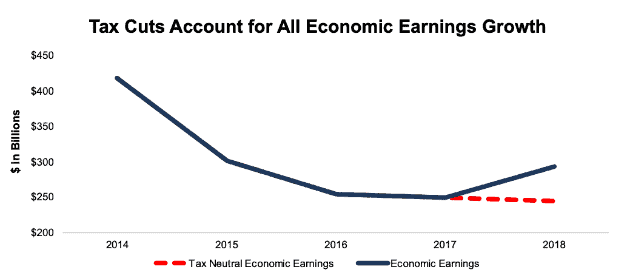
Sources: New Constructs, LLC and company filings.
Even with the benefit of the tax cut, all of the economic earnings growth in 2018 came from the Technology and Energy sectors. Both sectors grew their economic earnings by ~$50 billion in 2018, while the other 9 sectors combined saw a -$50 billion decline even with the tax cut.
Within the Technology and Energy sectors, economic earnings growth is highly concentrated. Just 25 Technology companies (6% of the Technology stocks we cover) accounted for all of the sector’s economic earnings growth in 2018. Even with tax cuts providing a tailwind, profit growth in 2018 was confined to a handful of big Technology companies and Energy companies boosted by rising oil prices, making good stocks even harder to find.
GAAP Earnings Mislead Investors
Per Figure 2, GAAP earnings have been rising since 2015 and grew by 23% in 2018. Investors who rely on GAAP net income will think that growth is strong, when in fact, real profits have been in a steady decline.
GAAP earnings get distorted by non-operating items, and they ignore the cost of equity capital. While the 2018 tax cut generates real cash savings, it is a one-time event unrelated to the core performance of businesses.
Figure 2: GAAP Earnings vs. Tax Neutral Economic Earnings Since 2014
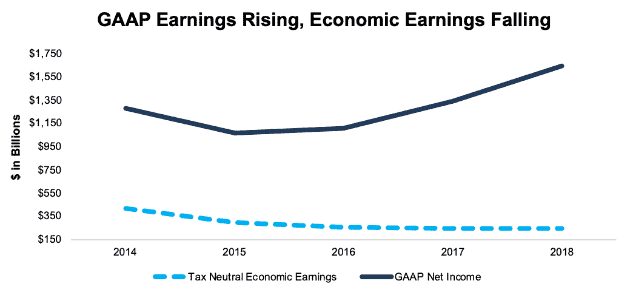
Sources: New Constructs, LLC and company filings.
Corporate America understands that its 2018 growth is an illusion. Companies have been slashing their earnings forecasts for 2019, which shows that they know a slowdown is coming. Meanwhile, the inverted yield curve shows that the bond market expects weak growth – or even a recession – in the near future.
Valuations Continue to Rise Despite Misleading Growth
Misleading GAAP earnings growth makes the market look less expensive. The P/E ratio of the S&P 500 declined from 25 at the beginning of 2018 to 19 at the end of the year. Even after the rally to start this year, the S&P’s P/E ratio still stands at just 21.
On the other hand, Figure 3 shows how much more expensive – and risky - the market truly is. Economic book value (EBV) – the no-growth growth value for the market – has declined to its lowest level since 2015. Meanwhile, stock prices are approaching the all-time highs set in September of last year.
Figure 3: Market Cap Vs. Economic Book Value Since 2014
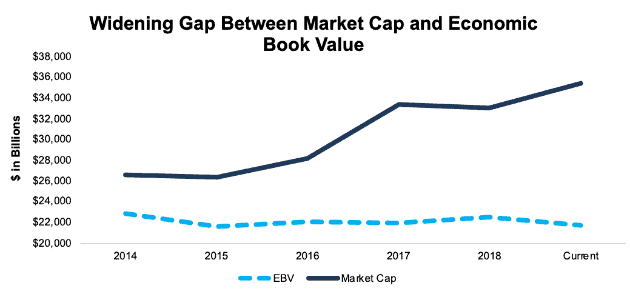
Sources: New Constructs, LLC and company filings.
We’re still nowhere near tech bubble territory, but the market is now more expensive than it’s been at any point since before the ’08 recession. This expensive valuation, combined with declining economic earnings and the inverted yield curve, should have investors worried.
Don’t Sell – Be Diligent
Red flags for the overall market don’t mean it’s time to sell everything.
Instead of going to cash, investors need to make sure they’re performing the proper level of diligence on the stocks in their portfolio. Companies that earn a sustainably high return on invested capital (ROIC) can perform well for investors even in a bear market.
Investors Should Avoid this Stock
Investors looking to safeguard their portfolios should stay away from United Technologies (UTX) due to its misleading earnings.
We previously warned investors about UTX in our article “Finding Danger in the Footnotes”. Our analysis of UTX’s 10-K showed that its $33 billion acquisition of Rockwell Collins failed to create value for investors, just as we predicted when the acquisition was first announced. UTX’s GAAP EPS increased by 14% in 2018, but its economic earnings per share decreased by 16%.
The decline in economic earnings stems from the fact that UTX’s ROIC stayed flat at 7% last year while its WACC increased from 5.5% to 5.8%. The company’s cost of capital is increasing, but its return on capital is stagnant.
UTX’s inability to improve its ROIC in 2018 is especially troubling due to the tailwind it received from the corporate tax cut. The company’s cash tax rate fell from 27% in 2017 to 24% in 2018, which provided a significant boost to net operating profit after tax (NOPAT). UTX grew NOPAT by 9% last year, but its pre-tax operating profit grew at a much slower rate of just 5%.
GAAP net income makes UTX look like a rapidly growing company, but in reality, that growth is just the product of overpriced acquisitions and tax cuts. The underlying fundamentals of the business look weak.
UTX Should Continue to Underperform
UTX has underperformed the market over the past two years (+13% vs. S&P +17%), and those using flawed traditional valuation metrics would believe UTX is now undervalued. At its current price of $128/share, UTX has a price-to-earnings (P/E) ratio of 19.5, slightly below the overall Industrials sector average of 20. However, when we analyze the cash flow expectations baked into the stock price, we see that UTX is significantly overvalued.
To justify its current price of $128/share, UTX must achieve 10% NOPAT margins (10-year average vs. 8% in 2018) and grow NOPAT by 7% compounded annually for the next decade. See the math behind this dynamic DCF scenario. These expectations seem overly optimistic given that UTX’s NOPAT has actually fallen by 1% compounded annually over the past decade and by 5% compounded annually over the past five years.
If UTX can maintain current NOPAT margins (8%) and grow NOPAT by 5% compounded annually for the next decade, the stock is worth just $92/share today – a 28% downside. See the math behind this dynamic DCF scenario.
Reported earnings make UTX look like a stock for investors that want growth at a reasonable price. In reality, the stock offers no growth and an expensive valuation.
This article originally published on April 1, 2019.
Disclosure: David Trainer and Sam McBride receive no compensation to write about any specific stock, style, or theme.
Follow us on Twitter, Facebook, LinkedIn, and StockTwits for real-time alerts on all our research.
[1] Done by using the same tax rate as 2017 for both NOPAT and the after-tax cost of debt in our WACC calculation.