
We closed this position on June 28, 2017. A copy of the associated Position Update report is here.
Oracle (ORCL $36.63/share) is undervalued compared to the broader market and relative to the firm’s potential.
Thesis: Management can boost the market value of ORCL in the amounts below[1] by aligning the firm’s strategy and performance compensation with real cash flows or what we call return on invested capital (ROIC).
Our thesis is predicated on the ideas that (a) real cash flows matter and (b) superior profitability is ultimately rewarded by the market.
While these ideas are by no means new, they are underappreciated these days for a variety of reasons, including the difficulty in applying them with scale. Nevertheless, if you think cash flow matters, we expect you will find our thesis on ORCL and ROIC compelling. We believe our proposals are very reasonable and Oracle’s management is well positioned to realize the potential value of implementing our proposals.
Figure 1: Value Creation Potential for ORCL Management
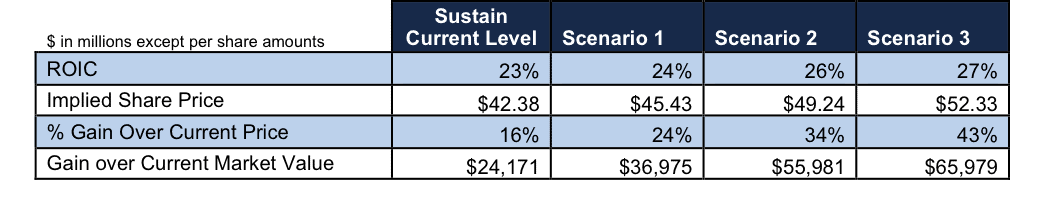
Sources: New Constructs, LLC and company filings.
We support our thesis by showing:
- How undervalued ORCL is relative to real cash flows and ROIC
- How to ensure the market rewards a higher ROIC
- Targeted proposals on how management can improve ROIC
- How to quantify the size of the prize if management improves ROIC
1. How Undervalued Is ORCL?
We find the relationship between ROIC and stock valuation intuitive. Over the long term, the market assigns the most value per dollar invested to the companies that produce the most cash per capital invested. Statistical analysis (see Figure 2 and additional Figures in Appendix B) shows that the biggest driver of stock valuation is, by far, ROIC.
Figure 2 also shows that Oracle is the cheapest among its peers and that ROIC explains 92% of the changes in stock valuation for ORCL and its peers.
Figure 2: Oracle Is The Cheapest Of Its Peers
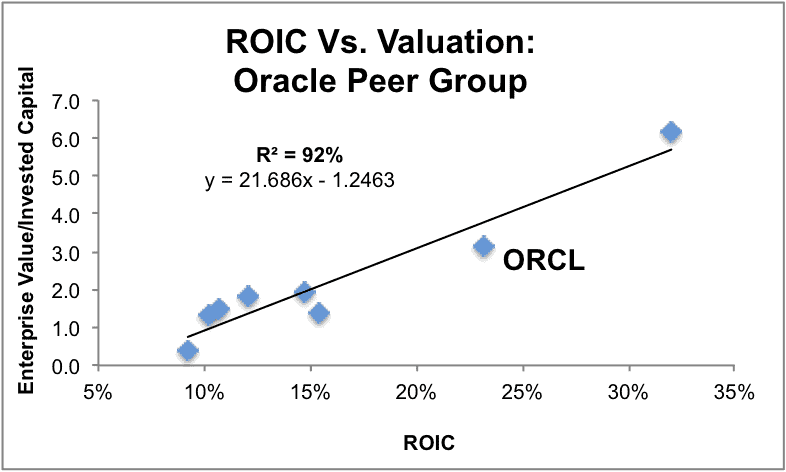
Sources: New Constructs, LLC and company filings.
In Appendix B, we provide further evidence for the explanatory power of ROIC and stock market valuations.
So What Is the Stock Worth?
Based on the linear equation from Figure 2, the stock is worth $42.38/share if we assume that Oracle can maintain its current ROIC of 23%. That upside translates into an additional $24 billion in market cap or $5.75 per share for investors.
The other way to interpret Figure 2 is to assess what the stock market is telling us by valuing ORCL at $36.63/share. By assigning ORCL an Enterprise Value/Invested Capital (a cleaner version of price-to-book) ratio of 3.25, the market is saying that it believes Oracle’s ROIC will permanently decline to 19%[2].
With market expectations so low, it is clear there is big upside for shareholders if management can convince the market it is focused on boosting ROIC.
Such a switch in focus is not necessarily easy. The prevailing focus of the stock market over the last several years has been on more technical measures of stock price performance. On the rare occasions when fundamentals are a topic of conversation, they are usually discussed in terms of earnings per share (EPS) instead of ROIC.
There has been a lack of focus by the markets on long-term, rigorous fundamental research for some time. As a result, most management teams focus instead on what analysts and investors ask for.
This opens the door for those managers who want to be ahead of the curve and earn premium valuations by focusing on ROIC. If you don’t buy into the regression above, then Figure 3 should convince you of the importance of ROIC for ORCL. The strength of the relationship between ROIC and valuation over all of Oracle’s post-tech-bubble history is clearly evident. Figure 3 also shows how much Oracle’s ROIC has fallen over the past decade.
Figure 3: ROIC Is Highly Correlated With ORCL’s Valuation

Sources: New Constructs, LLC and company filings.
Did Markets Lose Focus on ROIC?
Both the Enterprise Value to Invested Capital ratio of 98 and the ROIC of 388% in 2004 were unsustainable. But, very few management teams in the history of the world have been able to acknowledge (especially publicly) that their stock is overvalued. Instead, they land in The Overvaluation Trap and attempt to keep near-term market expectations as high as they can. That approach to running a company usually means management focuses on sell-side analyst reports and other market chatter that obsess on accounting results (mostly EPS) instead of real cash flows. One sure way to drive EPS is buying up other companies[3].
Over the past five years, ORCL has made a variety of acquisitions totaling over $20 billion. For a time, these acquisitions helped prop up the stock price by boosting EPS and exciting investors with new technologies and promises of potential growth.
However, the stock has fallen by 20% over the past year. Our research shows that those acquisitions have helped drive ORCL’s ROIC down from 30% to 23% and added $14 billion worth of goodwill to the balance sheet. The current stock valuation implies the market expects Oracle’s ROIC to continue to decline.
Figure 4 suggests that the acquisition-driven EPS growth has not had the intended impact on ORCL’s valuation.
Figure 4: EPS Growth Does Not Drive Value As Much As Market Rhetoric Suggests
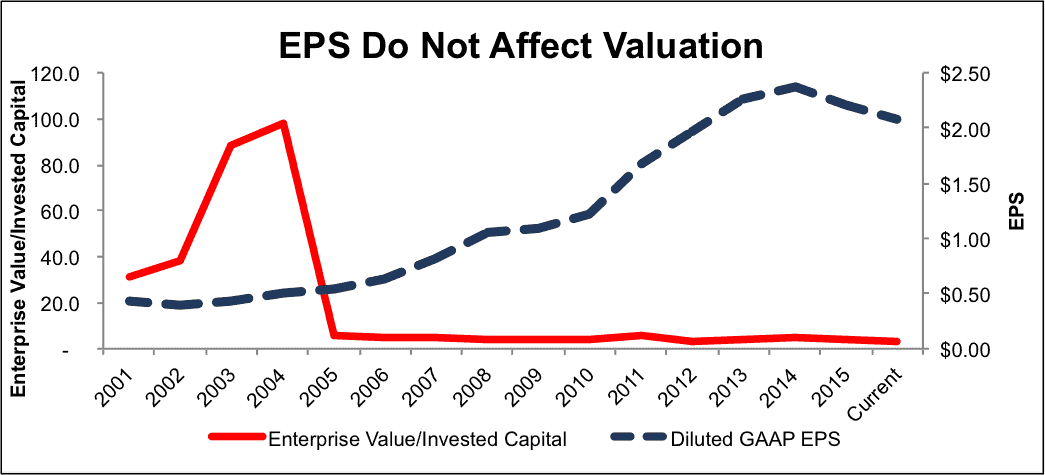
Sources: New Constructs, LLC and company filings.
2. How to ensure the market rewards the focus on ROIC
We believe the majority of institutional investors would enthusiastically welcome a return of focus on ROIC by management teams. In the mid 1990s, there was a large movement in the corporate community to focus on shareholder value. Unfortunately, this movement was overshadowed by the tech bubble and has never really recovered.
To get credit for focusing on ROIC, management needs to effectively communicate this shareholder value-based strategy to the investment community and show they are dedicated to it.
Investors are looking for four things when assessing management’s focus on ROIC:
a. Leadership: the focus on ROIC needs to start at the top, with the CEO. If the boss doesn’t back the plan, then it is hard to believe that everyone else will.
b. Tie to capital budgeting: every capital allocation decision needs to pass the “Net Present Value” test, which measures whether ROIC is greater than WACC, i.e. expected cash flows are high enough to cover all costs, including the cost of equity capital.
c. Tie to compensation: linking compensation to ROIC shows management wants to be accountable for the real drivers of valuation and sends a strong message about its priorities.
d. Communication: In addition to highlighting EPS growth, revenues, and other traditional metrics, management should highlight ROIC and how it is driving improvement of that metric.
Indeed, showing a clear link between management’s strategy and creating value for shareholders will likely compare well to the typical Wall Street road show. The more detailed that management can be about how it is driving a focus on ROIC through the organization, the more it can impress investors and the more likely it can earn a premium valuation.
We think investors would be impressed by a management presentation with an emphasis on improving ROIC over the long term as they were when Google became Alphabet.
We also think the size of the prize is large enough to warrant management’s attention. Below, we provide a framework for articulating to investors how management can drive increases in ROIC.
3. Targeted proposals on how management can improve ROIC and how much value that creates
Figure 1 shows how much the stock can gain if management convinces investors it can achieve four different levels of ROIC. The first scenario was covered above when we showed the stock price improvement that results from the market believing Oracle’s 23% ROIC can be maintained. The other three scenarios are based on management implementing the specific operational proposals below[4].
Overall, management wants to maximize future free cash flow. ROIC is not the only driver of future free cash flow, though it is the most important by far. There is even more upside to ORCL if management can achieve improvement in all drivers of free cash flow, which we list below.
- Increase ROIC[5].
- Extend the Growth Appreciation Period (GAP). This driver is also known as the Competitive Advantage Period (CAP). It links strategy to valuation and is measured with a dynamic discounted cash flow model.
- Increase revenue growth. This driver is last because it does not add value if the company’s ROIC is not above its WACC[6]. Top line growth is all too often the primary focus of investor attention when it should always be secondary to ROIC.
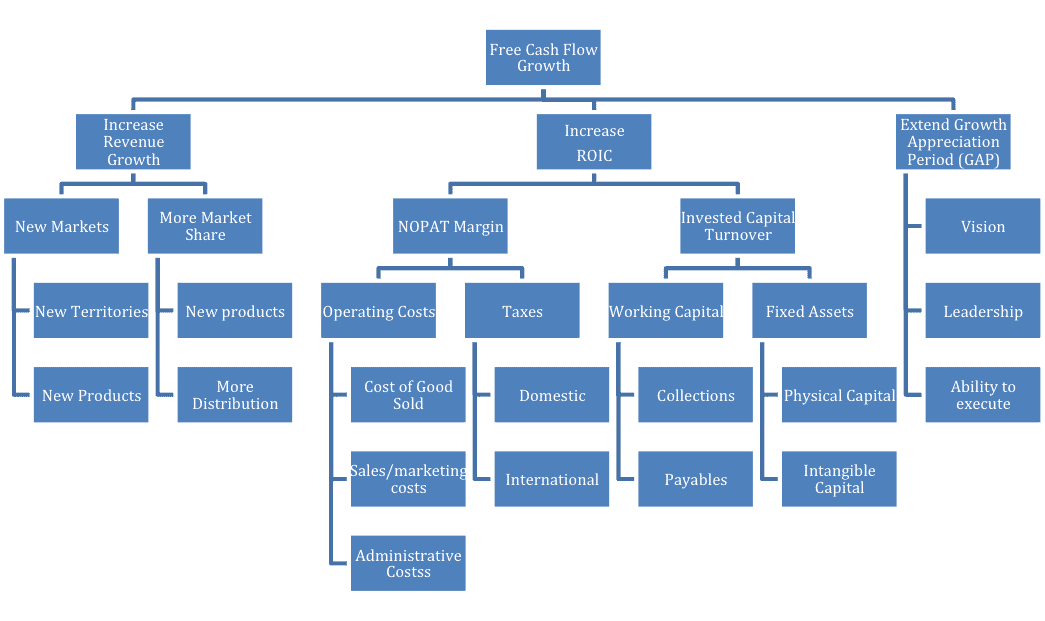
Per Figure VII in Appendix C, we can break each of these drivers down into more discrete elements of a business. As outsiders, we cannot go as deep as management. However, we recommend management show investors how they directly link the most discrete elements of the business to Free Cash Flow growth. This analysis should apply to each business line or division within a firm as well as the overall firm.
Recommendations for Increasing Free Cash Flow and Creating Shareholder Value
A. Increase ROIC:
We begin by breaking down ROIC into its prime components – NOPAT Margin and Invested Capital Turnover – so we can provide more targeted advice.
I. NOPAT Margin: Cost Management Could Be Improved
The focus on acquisitions appears to have hurt Oracle’s ability to manage its expenses. Normally, companies facing top-line pressure work hard to cut costs and maintain cash flows. We’ve seen that to a small extent from Oracle’s peers, which have trimmed Selling, General, and Administrative expense over the past five years.
Oracle, on the other hand, has seen its SG&A grow from 21.2% of revenue in 2011 to 23.5% over the trailing twelve months. That increase might seem like a relatively small amount, but it represents a loss of roughly $675 million in after tax income.
R&D represents another area with the potential to cut inefficient spending. Some of Oracle’s peers have increased their R&D by a significant amount, such as Intel, while others such as IBM have decreased their spending.
Oracle has gone with the heavy spending strategy, increasing R&D by 14% compounded annually over the past decade. The value of such heavy spending has been called into question by academic research that finds a negative correlation between R&D as a percent of revenue and total returns for large-cap tech companies. Moreover, given the decline in ROIC, it appears the firm is not getting a good return on its R&D investments. Perhaps, management would benefit from focusing either on internal product development (i.e. R&D) instead of external (i.e. acquisitions) rather than both.
Given the findings above, consultants could deliver value for Oracle by pitching services to decrease overhead, better manage personnel, or get more productivity from R&D.
II. Capital Turnover: Acquisition Strategies Are Expensive And Deliver Low Return
When optimizing the balance sheet, the general strategy is divesting unproductive assets. An examination of Oracle’s balance sheet shows that it utilizes its tangible capital at a high level of efficiency, so there’s not a lot of potential improvement on that end. We see potential in addressing the $40 billion in Goodwill and other Intangibles from numerous acquisitions. Culling as much dead weight here as possible can help.
However, there may be potential to help Oracle earn more revenue from its current invested capital. In particular, the company says in its 2014 10-K that it undergoes periodic restructuring of its sale force that result in “temporary reduced productivity while the sales teams adjusted to their new roles and responsibilities.” A solution that helps Oracle manage these restructurings with less impact on productivity could boost sales.
That leaves the question of what Oracle will do with its significant ($50 billion) in excess cash. The company should funnel some of what it would spend on acquisitions into internal investment, but it’s possible that there are not enough productive uses for that capital. Share buybacks make more sense when the stock is cheap.
B. Increase Revenue Growth
Within the discipline of improving ROIC, we can propose strategies for growing revenue. Growing revenue without regard to whether or not ROIC exceeds WACC can lead to shareholder value destruction. Per Figure VII in Appendix C, the company can grow revenue by selling into new markets or creating new products. These goals can be accomplished in many ways. The one way we recommend that management not grow the top line is by acquisition given the negative impact on ROIC.
One new strategy for enhancing revenue growth is to leverage a framework like the one we’ve presented in this proposal. Linking the value of Oracle’s software and services directly to shareholder value empowers the sales force with a differentiated selling strategy. This approach could also boost the sales force’s ability to engage the c-suite by linking the impact of Oracle’s software and services directly to the client’s stock price.
In the context of the regression analysis, a higher or lower revenue growth (relative to peers) manifests in a stock trading above or below the trend line.
C. Extend Growth Appreciation Period (GAP)
Whereas revenue growth and ROIC can be measured concretely, GAP is harder to quantify. With the right tools, though, we can calculate the future cash flows required to justify a given stock price. Our dynamic DCF model gives us a “market-implied GAP” that shows how many years of profit growth the market embeds in share prices. This model also allows us to measure the concrete amount of value created or lost by extending or shortening GAP. While we can discretely measure the impact of GAP on valuation, we do not pretend we can predict what GAP will be. Ultimately, the length of GAP in the stock price will be a function of how well management can convince investors of its ability to sustain a high ROIC. Please refer to section “2. How to ensure the market rewards the focus on ROIC” for our proposal on how to communicate with investors.
Convincing investors that the company and management deserve a longer GAP is a key way to earn and keep a premium valuation. In the context of the regression analysis, a longer or shorter GAP (relative to peers) manifests in a stock trading above or below the trend line.
4. How to quantify the size of the prize if management improves ROIC
These scenarios apply to both the existing investments in the business as well as to new investments. The key is to analyze both through the lens of ROIC and its drivers.
Scenario 1: Since SG&A is the largest operating expense for Oracle, its reduction drives the most value. Bringing SG&A as a % of revenue down 200 basis points from 23.5% to 21.5% of revenue would drive an increase of 160 basis points in the NOPAT margin and an increase of 130 basis points in ROIC, to 24%. This improvement in ROIC would increase Oracle’s market value by $37 billion and give it an implied share price of ~$45.43[7].
From another perspective, for every 100 basis points of decrease in the SGA expenses, management can add about $1.5 billion in market value. More details are in Appendix A Figure IV.
Scenario 2: Oracle currently spends 15.1% of revenue on R&D compared to an average of just 11.7% for its peers. If increased efficiency could help Oracle get its R&D expenses down to 12.6% of revenue, the firm would get an increase of 200 basis points in its NOPAT margin and an increase of 160 basis points in ROIC. Along with the SG&A improvement, we’re looking at an additional $1.3 billion a year in after tax profit (NOPAT) and an implied valuation of ~$49.24/share ($53 billion increase in market cap).
Scenario 3: Finally, if we assume that an improvement in sales force productivity could deliver an extra 5% to revenue while keeping the cost levels above and, importantly, not adding any invested capital, then we see an improvement in capital turns from 0.81 to 0.85. In turn, ROIC goes from 26% to 27%. Combined with the cost savings, we get an additional $1.9 billion of NOPAT and an implied stock price of ~$52.33/share, which equals a $66 billion increase in market cap.
Figure 1 summarizes the value creation opportunities for these three scenarios along with the value of maintaining the current level of ROIC. Appendix A Figure III has details behind all of these calculations.
Figure 5 goes one step further to analyze how management might consider compensating those that help execute the value-creating strategies. Rather than pay traditional rates and fees, one could propose a gain share model to ensure your consulting partners are aligned with increasing ROIC.
The total increases in market value under each scenario are impressive. Offering just 1/100th of a percent of those gains provides a healthy payday to implementation and consulting partners while still handsomely rewarding investors.
Figure 5: Potential Market Value Gains Are Substantial
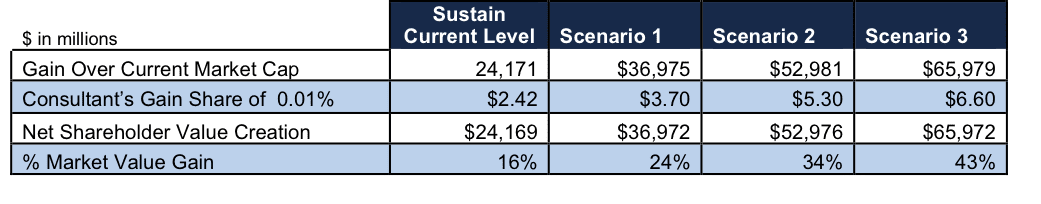
Sources: New Constructs, LLC and company filings. See Appendix B for details on calculations behind these results.
Note that in each of the scenarios above, we assume that Oracle will trade at par (on the regression trend line) with its peers based on its ROIC. The stock would warrant a premium valuation (above the trend line) by virtue of management’s focus on ROIC and its ability to communicate that focus to investors. Either way, we believe we have presented both a very achievable and meaningful opportunity for Oracle’s management to create value for investors.
Competitive Strength Vs. Peers Makes ROIC Goals Appear Doable
As part of the process for developing specific recommendations on how management can drive free cash flow growth, we review how Oracle and its peers have performed along the drivers of free cash flow growth over the past several years.
Most of the big, established tech names have struggled in recent years owing to increased competition. That’s borne out by Figure 6, which shows every single one of them experiencing declining ROIC.
Figure 6: All Of Oracle’s Peers Are Struggling

Sources: New Constructs, LLC and company filings.
Figure 7 shows that declining invested capital turns have been the main driver behind this downward trend in ROIC. All these companies have pumped more money into their business while revenues have stayed flat or even declined slightly (except for HPQ, which has actually decreased its invested capital, but has seen revenue fall by even more).
Figure 7: Can’t Turn Investment Into Revenue
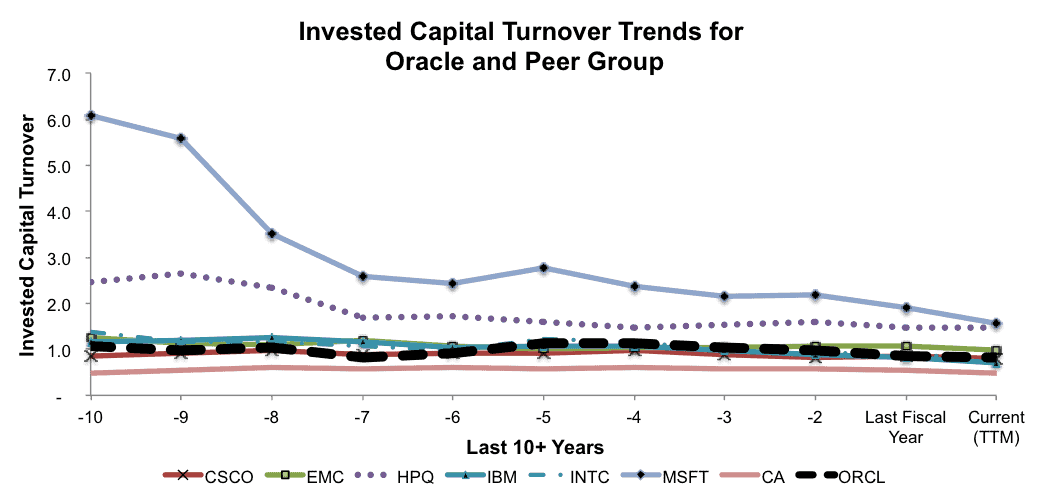
Sources: New Constructs, LLC and company filings.
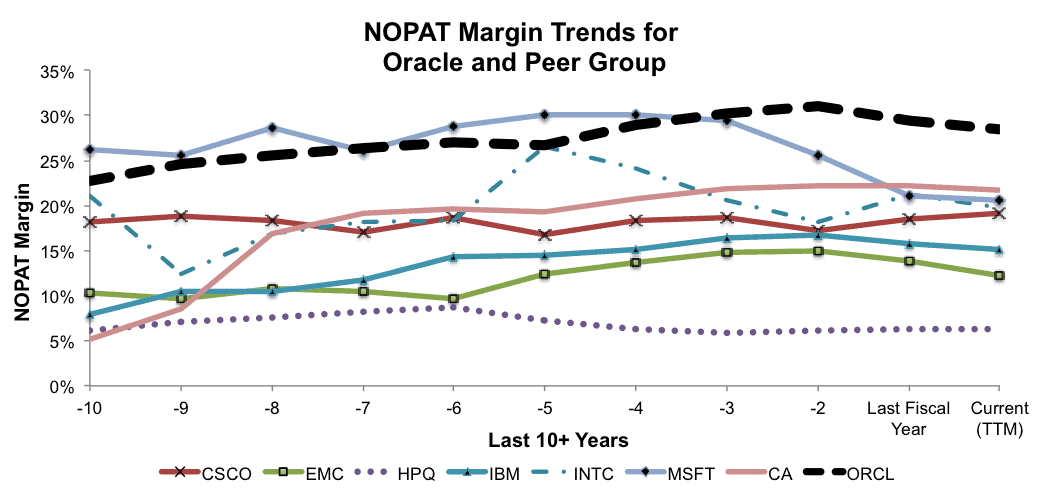
On the other hand, margins have been more of a mixed bag. Some companies (MSFT, INTC) have experienced a steady decline. Others (CSCO, CA) have steadily improved. Oracle has gone in both directions, with margins rising initially, then peaking in 2014 and falling since. See Figure 8.
Figure 8: Mixed Bag For Margins
Sources: New Constructs, LLC and company filings.
While many of these companies have grown revenues rapidly in the past, currently they are all experiencing revenue declines or, at best, low single digit growth – as shown in Figure 9.
Figure 9: No Longer A Growth Story

Sources: New Constructs, LLC and company filings.
As these charts show, Oracle’s business may be facing some challenges, but when compared to similar companies it remains a leader.
Figure 10 shows that Oracle ranks at or near the top of its peer group for ROIC and margins.
Figure 10: Oracle Stacks Up Well Against Peers
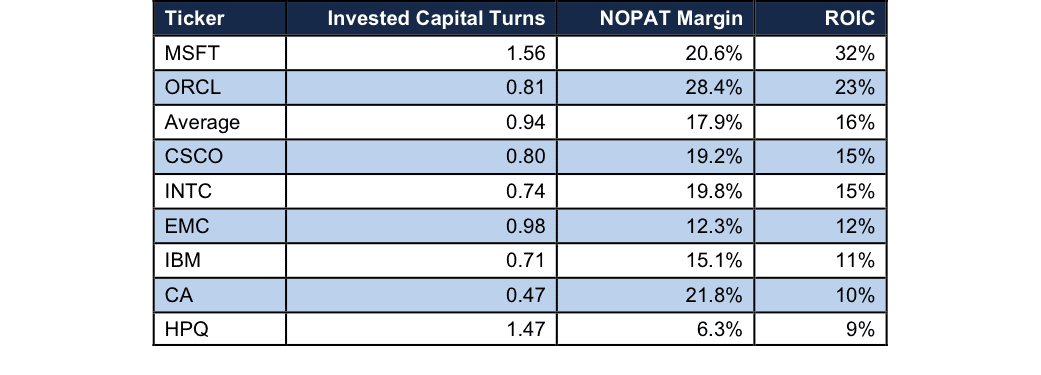
Sources: New Constructs, LLC and company filings.
Conclusion
Given its strong standing amongst its peers, it is hard to understand why ORCL should be trading at a discount. We think the case for earning a higher valuation is logical and looks achievable.
We’ve attempted to provide a very clear path forward for management along with a robust indication of how much value that path could create for shareholders. This path could require a bit of a change in mind set, but we think it is worthwhile.
The existing mind set has led Oracle to be a serial acquirer for years. The firm has deployed a lot of capital to buy up smaller companies to build scale and increase its margins. Figures 6-9 demonstrate that this acquisition-heavy strategy is no longer yielding the same results.
We think most sophisticated investors know that acquisitions tend to be value destroying and that takeovers destroy more value for larger acquiring companies. As a $154 billion market cap company, Oracle simply can’t derive the same advantages from acquisitions that it could 10 or 15 years ago.
The company’s executive compensation structure continues to incentivize acquisitions. Executive bonuses are tied to revenue growth and cash provided by operating activities. The market appears to be taking note and awarding ORCL lower expectations for future cash flows based on this strategy.
With that in mind, ORCL should put less of an emphasis on growth through acquisitions and focus more on incremental shifts to maximize long-term free cash flow and ROIC. This might not be the most exciting strategy, but Figures 4 and 5 show that it has the potential to be a very lucrative one.
While we cannot promise as large an increase as what GOOGL enjoyed last summer, if management were to signal a shift toward a more ROIC-centric strategy, we think the market could quickly move ORCL from a discount to a premium valuation.
Appendix A: Implied Values Based on Linear Equations from Regression Analyses
Figures I – IV show how we calculate the implied share prices and ROIC based on the three regression analyses in this report. Click here for the original spreadsheets with all calculations and details.
Figure I: Implied Stock Price and Upside for ORCL Based on Linear Equations from Regressions
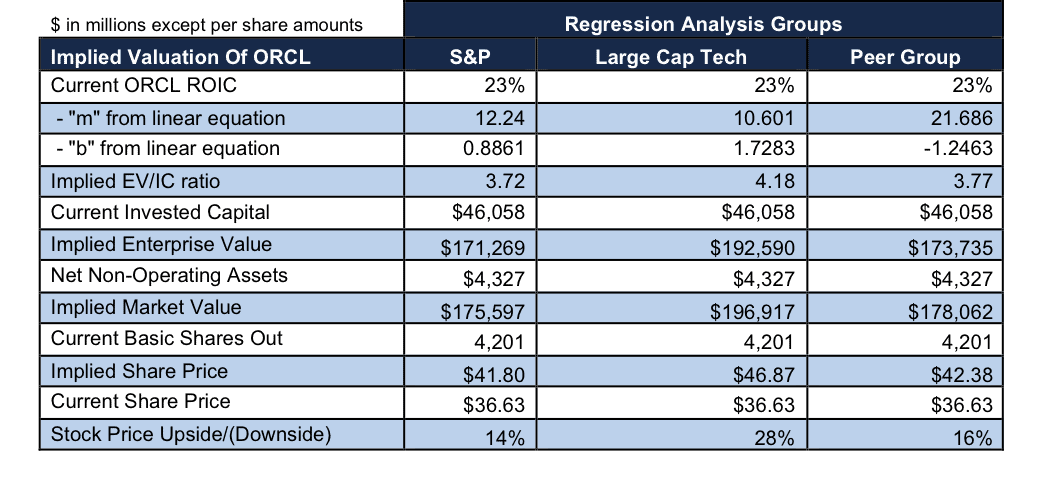
Sources: New Constructs, LLC and company filings.
Figure II: Implied ROIC for Oracle Based on Linear Equations from Regressions
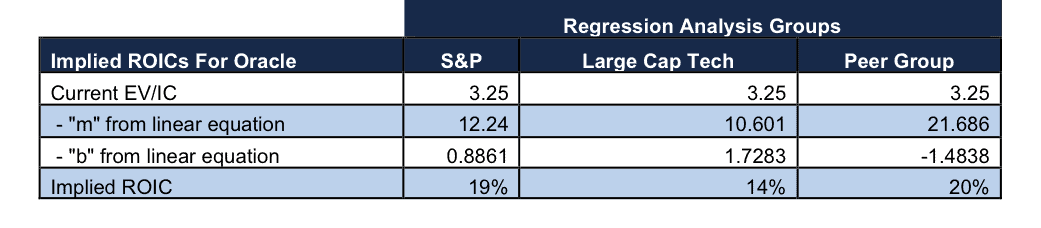
Sources: New Constructs, LLC and company filings.
Figure III: Implied Value Creation Scenario Details
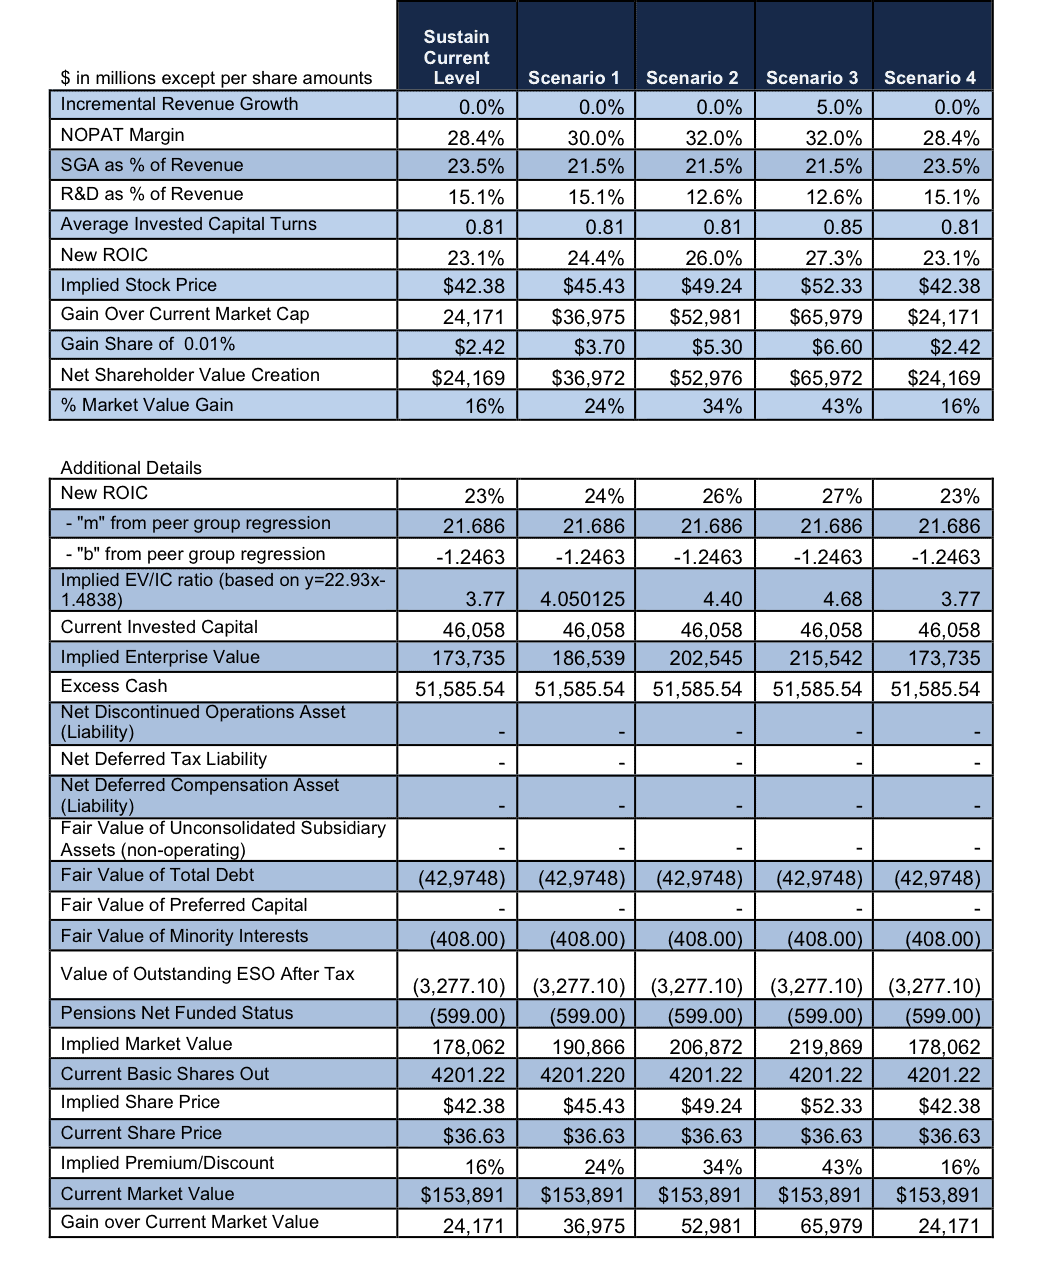
Sources: New Constructs, LLC and company filings.
Figure IV: Impact on Market Value from Changes in SG&A
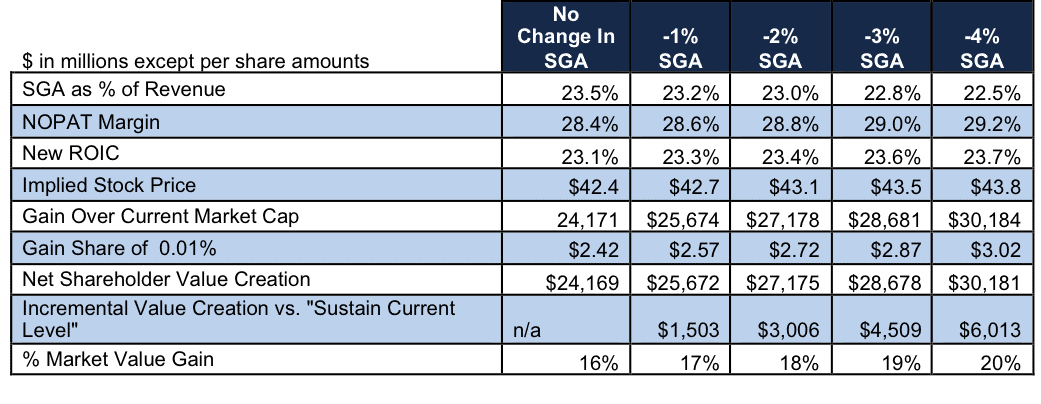
Sources: New Constructs, LLC and company filings.
We can provide the same analysis in Figure IV for any financial line item whether it comes from the income statement, balance sheet or management’s internal numbers.
Appendix B: More Regression Analyses Details
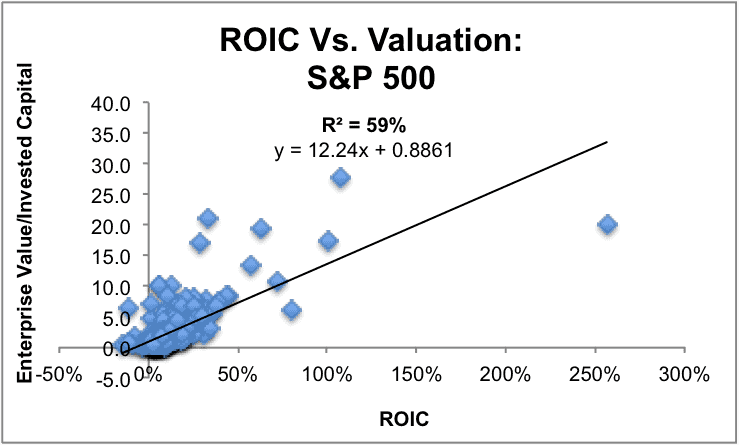
Figures V and VI show additional regressions of ROIC vs. Enterprise Value/Invested Capital (a cleaner version of price-to-book). The relationship between ROIC and valuation holds quite strongly on larger groups of stocks. Figure V shows that ROIC explains 59% of the changes in valuation for the stocks in the S&P 500.
Verify the data and regression analyses in the original spreadsheet here.
This regression framework for stock valuation was first introduced long ago by folks with much more impressive pedigrees than ours: McKinsey’s Valuation Handbook, Bennett Stewart’s Quest For Value, Credit Suisse’s Michael Mauboussin’s ROIC Patterns and Shareholder Returns. The innovation we bring to the table is modeling ROIC, free cash flow and GAP, etc. with scale.
Figure V: ROIC Drives Valuations for the S&P 500
Sources: New Constructs, LLC and company filings.
Figure VI (r-squared is 67%) shows that the explanatory power of ROIC for stock prices gets stronger when we narrow the focus to large cap tech stocks.
Figure VI: Oracle Still Cheap Versus Other Tech Companies

Sources: New Constructs, LLC and company filings.
Appendix C: Free Cash Flow Growth Breakdown
Figure VII: Drivers Of Free Cash Flow Growth
Sources: New Constructs, LLC and company filings.
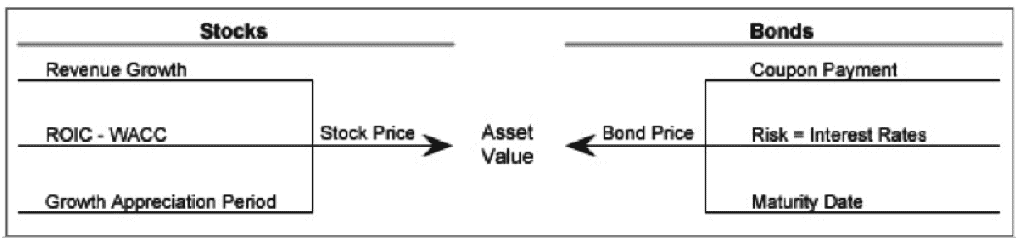
As discussed in our post, “How New Constructs’ Discounted Cash Flow Model Works,” stock valuations and bond valuations can be understood in the same way. For stocks, valuation is driven by revenue growth, ROIC, and GAP. For bonds, valuation is driven by coupon payments, risk, and maturity date. The Growth Appreciation Period (GAP) for stocks is analogous to the maturity date for a bond.
Figure VIII: How To Price Stocks And Bonds
Sources: New Constructs, LLC and company filings.
Executives can increase shareholder value by proving to the market that the company has a sustainable competitive advantage and a longer GAP. In the context of the regression analysis, a longer or shorter GAP (relative to peers) manifests in a stock trading above or below the trend line.
Appendix D: Linking Enterprise Value to ROIC
ROIC and free cash flow all tie back to enterprise value as we show below in Figure IX. Click here for the original spreadsheets with all calculations and details.
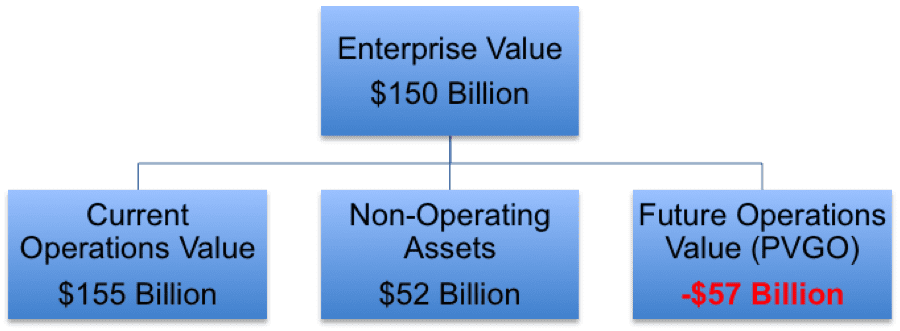
Figure IX: The Elements Of Enterprise Value
Sources: New Constructs, LLC and company filings.
- Current Operations Value is also known as the no-growth value of the business based on the assumption that cash flows never grow from current levels. We measure it by dividing current cash flows[8] by the cost of capital or NOPAT/WACC, and it equals $155 billion for Oracle. This calculation is also known as the perpetuity value of current cash flows or “pre-strategy value”.
- Non-Operating Assets for Oracle equal $52 billion, which is excess cash[9].
- Future Operations Value is also known as the Present Value of Future Growth Opportunities or “PVGO”. This value captures the impact of what management does for the future of a company. We measure it as Enterprise Value minus Current Operations Value and Non-Operating Assets.
A key benefit of breaking down the enterprise value per Figure VII is to bring into clear focus the importance of PVGO. Understanding that we cannot change the past, a clear focus on future operations is important. We are not saying that nothing can be done to improve current operations or net non-operating assets, and they should not be entirely overlooked. We are saying that the majority of focus should be on the future operations value because that element of enterprise value will, most likely, have the largest impact on the value of the business in the future.
Given the regression analyses showing that the market expects ROIC to permanently decline, we are not surprised to see that the PVGO is -$57 billion[10].
Naturally, management’s focus should be primarily on PVGO. Figure VIII shows the drivers of PVGO, the most important of which is future free cash flow growth.
Looking at enterprise value from this perspective shows how the drivers of free cash flow drive enterprise value.
Figure VII in Appendix C takes the breakdown even further to show how to link even the most discrete parts of the business to free cash flow. We hope this details help support the rigor of our thesis as well as the ease of its implementation.
Figure X: The Drivers Of Future Operations Value
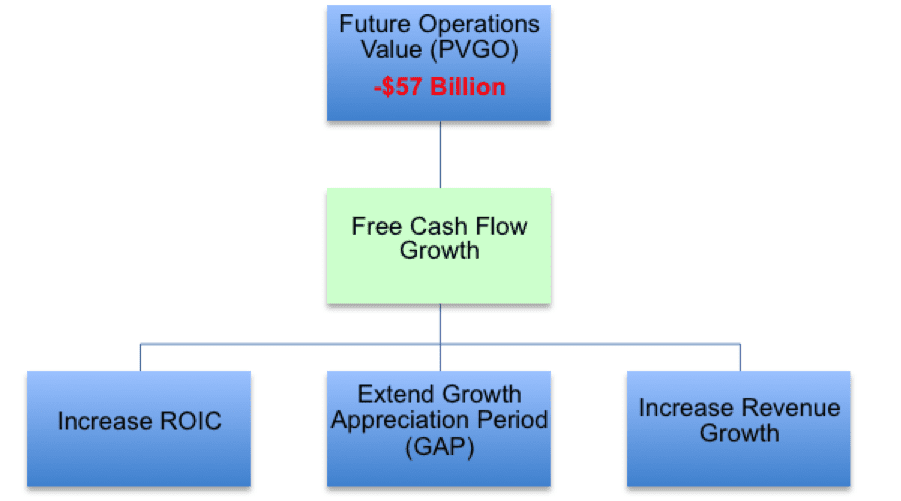
Sources: New Constructs, LLC and company filings.
While all three factors play an important role, ROIC is the most important factor. Revenue growth without an ROIC above WACC destroys shareholder value, and a consistently high ROIC is the strongest signal a company can send to the market that it has a sustainable competitive advantage and deserves a long GAP.
[1] Details behind the calculations in Figure 1 are in Appendix A.
[2] See Figures I and II in Appendix A for details behind the calculations of the implied stock prices and implied ROIC.
[3] Using M&A to drive EPS can boost accounting results despite hurting ROIC – aka the Hi/Lo Fallacy.
[4] Please see Figure III in Appendix A for details behind the calculations of the implied stock prices and ROIC.
[5] Technically this driver is ROIC-WACC. We focus on ROIC given that most of WACC is the cost of equity, which is largely outside of management’s control. ROIC reflects the operations of the business, where management can effect the most change.
[6] See Scenario 4 in Figure III in Appendix A for an example of how revenue growth without a change in ROIC creates no incremental value. The spreadsheet that provides all the implied values is available at this link.
[7] For the calculations of implied market values and stock prices, see Appendix A.
[8] Note that NOPAT is the same as Free Cash Flow when we assume there is no growth in the business.
[9] More details on non-operating assets are in our Economic Book Value definition.
[10] PVGO, in this instance, refers to all stakeholders. The market value, i.e. equity stakeholder portion, of the PVGO is $9.6 billion.
Disclosure: David Trainer and Sam McBride receive no compensation to write about any specific stock, sector, style, or theme.
Click here to download a PDF of this report.
Photo Credit: Delwin Steven Campbell (Flickr)