
We published an update on PCAR on Nov 18, 2021. A copy of the associated Earnings Update report is here.
Check out this week’s Danger Zone interview with Chuck Jaffe of Money Life.
Despite the essential nature of the trucking industry, too many investors overlook the firms supplying the trucking industry. While the COVID-19 pandemic is hurting the trucking industry in the short-term, we believe the long-term growth of the industry remains intact. Investors overlooking PACCAR Inc. (PCAR: $79/share) are in the Danger Zone. Despite rebounding from its March lows, there’s still value in this Long Idea.
PACCAR’s History of Profit Growth
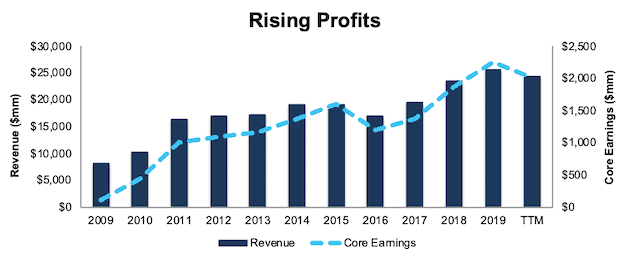
PACCAR has a strong history of profit growth. Over the past decade, PACCAR has grown revenue by 12% compounded annually and core earnings[1] by 36% compounded annually, per Figure 1. Core earnings provide a better measure of profitability and truer insights into valuation than similar measures of profits from legacy data providers.
Longer term, PACCAR has grown core earnings by 7% compounded annually over the past two decades. The firm increased its core earnings margin year-over-year (YoY) in nine of the past ten years and from 1% in 2009 to 8% in the trailing-twelve-month period (TTM).
As expected, TTM core earnings have declined significantly as the COVID-19 pandemic shuttered economies across the globe. We expect core earnings and other profitability metrics may get worse before they get better. However, our thesis does not depend on profit growth, as we’ll explain in the valuation section of this report.
Figure 1: Core Earnings & Revenue Growth Over the Past Decade
Sources: New Constructs, LLC and company filings.
PACCAR’s rising profitability helps the business generate positive free cash flow (FCF) in each of the past ten years and a cumulative $6.3 billion (23% of market cap) over the past five years. PACCAR’s $1.9 billion in FCF over the TTM period equates to an 8% FCF yield, which is well above the Industrials sector average of 2%.
Executive Compensation Plan Incentivizes Prudent Capital Stewardship
No matter the macro environment, investors should look for companies with executive compensation plans that directly align executives’ interests with shareholders’ interests. Quality corporate governance holds executives accountable to shareholders by incentivizing them to allocate capital prudently. PACCAR management frequently references return on invested capital (ROIC) in earnings calls and investor presentations. Best of all, management doesn’t just talk about ROIC, they’re paid to improve ROIC.
PACCAR’s long-term incentive compensation includes both equity and cash-based awards and represents anywhere from 31% to 52% of compensation depending upon the executive. The cash portion of this long-term compensation is paid out based on the three-year change in return on capital (similar to ROIC), net income, and return on sales compared to peer companies.
The focus on return on capital aligns the interests of executives and shareholders and ensures executives are held accountable for creating shareholder value. PACCAR has improved its ROIC from 7% in 2010 to 20% TTM while increasing its economic earnings from $42 million to $1.5 billion over the same time.
Strong Balance Sheet Provides Liquidity to Survive Prolonged Downturn
Companies with strong liquidity are better positioned to survive macro-economic uncertainty. PACCAR has ample liquidity to survive the current economic downturn. At the end of 1Q20, PACCAR had $4.3 billion in cash on hand and $3 billion in available bank facilities.
In a worst-case scenario, where PACCAR generates no revenue, the firm could operate for 30 months with just its cash on hand, at which point it could then tap its bank facilities for additional capital. This scenario assumes PACCAR maintains research & development, selling, general & administrative, and interest and other borrowing expenses at 1Q20 levels. We also assume the firm maintains its capex spending consistent with its 2020 guidance of $525-$575 million.
However, it’s highly unlikely that PACCAR’s revenue would go to zero given truck production has resumed at select factories, the firm delivered over 38,000 trucks in 1Q20 (which included some of the nationwide shutdown), and consensus estimates expect revenue to fall 37% (not 100%) in 2020.
Profitability Is Rising and Top Amongst Peers
Before the current crisis, PACCAR’s profitability was higher and improving at a faster pace than its peers. This improved profitability is a testament to the firm’s investment in updated manufacturing facilities, manufacturing automation, parts distribution centers, and effective management of production to match industry demand. With improving profitability and a strong balance sheet, PACCAR can not only survive the downturn, but is well-positioned to take market share from other truck manufacturers as the economy recovers.
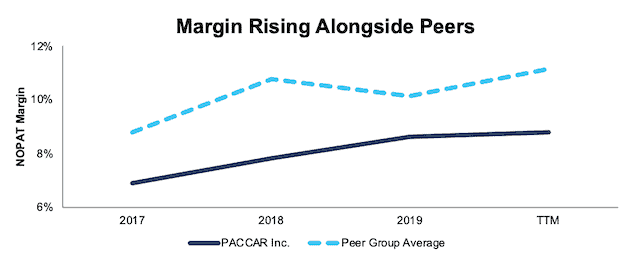
Per Figure 2, PACCAR’s net operating profit after-tax (NOPAT) margin has improved from 7% in 2017 to 9% TTM. Over the same time, the market-cap-weighted average of 21 other Heavy Machinery and Vehicles firms improved at a similar rate, from 9% to 11%. This peer group includes Navistar International (NAV), Oshkosh Corporation (OSK), Allison Transmission Holdings (ALSN), AGCO Corporation (AGCO), and more[2].
Figure 2: NOPAT Margin Vs. Peers
Sources: New Constructs, LLC and company filings.
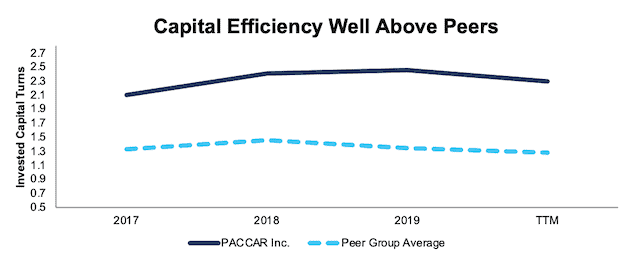
PACCAR’s invested capital turns, a measure of balance sheet efficiency, have increased from 2.1 in 2017 to 2.3 TTM. The peer group’s market-cap-weighted average invested capital turns have remained at 1.3 over the same time.
Figure 3: Invested Capital Turns Vs. Peers
Sources: New Constructs, LLC and company filings.
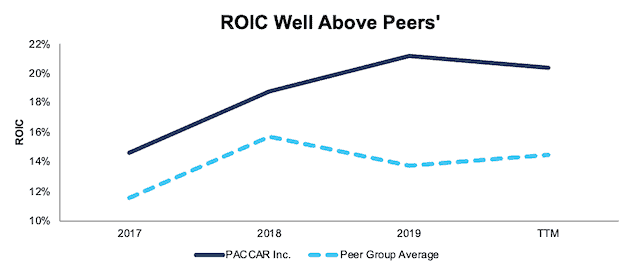
The combination of rising margins and invested capital turns drives PACCAR’s return on invested capital higher. Per Figure 4, PACCAR’s ROIC has improved from 14.6% in 2017 to 20.4% TTM while the market-cap-weighted average ROIC of peers has improved at a slower rate from 11.5% to 14.5% over the same time.
Figure 4: ROIC vs. Peers
Sources: New Constructs, LLC and company filings.
Unless you believe that there will be no need for light-, medium-, and heavy-duty trucks in a post-COVID-19 world, it’s hard to argue against PACCAR’s ability to survive. And, if it survives, it’s hard to argue that the firm’s superior profitability before the crisis will not translate into market share and profit growth after the crisis.
Building the Blocks of the U.S. Economy
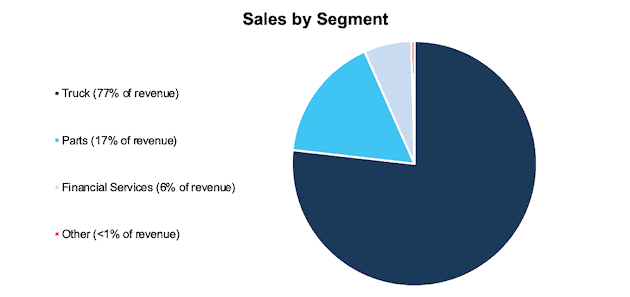
PACCAR supplies the backbone of much of the global economy. According to the American Trucking Associations (ATA), nearly 74% of all freight transported in the United States in 2019 was hauled via truck. Furthermore, a study done by the ATA found that most grocery stores would run out of product in just three days without long-haul trucks. Through the production of well-known brands Kenworth, Peterbilt, and DAF, PACCAR generated 77% of its TTM revenue from its truck segment.
Figure 5: PACCAR Revenue by Business Segment – TTM
Sources: New Constructs, LLC and company filings.
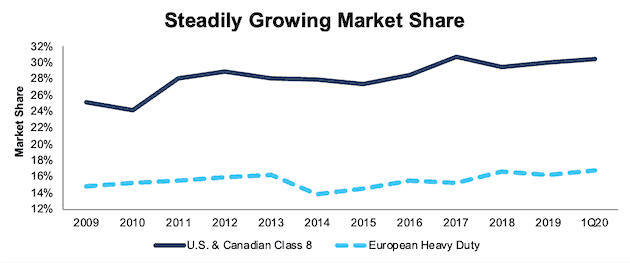
Best of all, PACCAR has been growing its market share, both domestically and abroad in this key industry. Per Figure 6, PACCAR’s U.S. & Canadian class 8 market share has improved from 25% in 2009 to 30% in 1Q20. Additionally, its European Heavy Duty market share has improved from 15% to 17% over the same time. PACCAR’s U.S. & Canadian Medium Duty market share has improved from 15% in 2012 to 17% in 2019.
Figure 6: PACCAR’s Market Share in U.S., Canada, and Europe
Sources: New Constructs, LLC and company filings.
While short-term expectations for North American commercial vehicle demand have soured, ACT research, an industry data provider, believes “longer-term assumptions are unchanged presently, with expectations that markets will recover to trend starting in 2022.” In fact, this report expects the heavy-duty commercial segment to grow 5% compounded annually from 2020 to 2025. Research and Markets expects the entire North American Truck market to grow by 14% compounded annually over the same time.
Furthermore, we believe an economic recovery is likely over the long term as the International Monetary Fund (IMF) and nearly every economist in the world believe the global economy will grow strongly in 2021. The IMF estimates the global economy will expand by 5.4%, and the U.S. economy by 4.5%, in 2021. Fitch Ratings projects global GDP growth of 4.9% in 2021, and for pre-virus levels of GDP to be reached in 2Q22 in the U.S. and 4Q22 in Europe. FTR, a leading freight transportation data provider expects truck freight total loadings to return to pre-crisis levels in the second half of 2021, after falling 6% YoY in 2020. Increased demand for freight ultimately means greater demand for light-, medium-, and heavy-duty trucks.
Electric Vehicles Aren’t the Near-Term Concern Many Believe
The elephant in the room in any discussion about traditional combustion vehicles, from cars to heavy-duty trucks, is the rapid growth and adoption of electric and other alternative fuel models. Just recently, Tesla (TSLA) confirmed that it was moving forward with plans to bring Class 8 semi-trucks to volume production. Given that PACCAR’s business has historically come from more traditional models, some may interpret this advancement as bad news.
However, the high growth rates for EVs and alternatives is mostly due to starting from a very small base, and the overall impact on the industry won’t be significant for many years to come. IDTechEx expects electric trucks to make up 9% of the medium- and heavy-duty truck market by 2030. While that is a significant amount ten years from now, over 90% of the market – in which PACCAR has been growing its share for decades – is for traditional trucks.
But EVs Do Represent Long-Term Opportunity
There is no denying the future of all vehicles is likely in electric, or some other alternative fuel, as regulations around the globe limit greenhouse gas emissions and provide incentives for alternative vehicles.
PACCAR, while not as flashy as a Tesla, is not sitting on the sidelines waiting for someone else to make electric trucks.
PACCAR recently announced a partnership with Dana Holding Corp (DAN) to produce electric powertrain versions of the Kenworth K270 and K370 and Peterbilt 220 trucks. These trucks are best suited for local pickup and delivery trips, as well as short regional hauling. This announcement adds to Peterbilt’s 520EV and 579EV refuse and day-cab trucks. Peterbilt’s model 220 EV is already in testing with Frito-Lay, a division of PepsiCo (PEP), and Peterbilt will begin low volume production of all three electric trucks by the end of 2020.
In the meantime, PACCAR is field-testing these trucks, and more, such as hydrogen fuel cell and hybrid powertrain trucks, with customers in North America and Europe. Gathering valuable feedback from test users helps ensure a better product and higher customer adoption. Best of all, PACCAR can leverage its existing customer relationships, manufacturing scale and expertise, and dealership and parts distribution networks to create a seamless transition to EV trucks as the demand rises in the future. In other words, like General Motors (GM), when PACCAR gets into the EV business, it will arrive with formidable scale, supply-chain, maintenance, distribution and cost advantages versus new-entrants like Tesla.
An Autonomous Future Drives Growth Over the Long-Term
Beyond EVs and alternative fuel vehicles, the future of all vehicles, trucks included, rests with autonomous vehicles. While still many years out, autonomous vehicles remove many of the limitations of human drivers, such as slower reaction time and fatigue and will, eventually, increase a truck fleet’s safety and efficiency.
Kenworth revealed the T680 truck at the Consumer Electronics Show in early 2020. This long-haul truck, built at PACCAR’s Innovation Center, boasts level 4 autonomy, which offers fully autonomous operation in certain conditions. This technology is aimed at increasing driver safety and efficiency, as the driver does not need to be fully in control during travel.
Autonomous vehicles can also solve a big problem in the trucking industry – labor shortage. The American Trucking Associations expects the truck driver shortage to double in a decade, as fleets struggle to replace aging drivers. PACCAR is well-positioned to help fill this void and profit from this growth opportunity.
PCAR Trades Well Below Its Economic Book Value
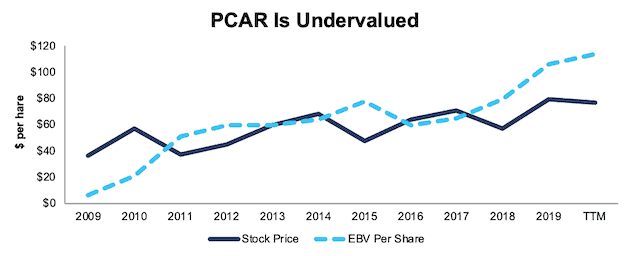
Despite rebounding from its March lows, at $79/share PCAR still trades below its economic book value, or no-growth value and at a price-to-economic book value (PEBV) ratio of 0.7. This ratio means the market expects PACCAR’s NOPAT to permanently decline by 30% and represents the lowest ratio since 2015. This expectation seems overly pessimistic over the long term.
PACCAR’s current economic book value is $113/share – a 43% upside to the current price.
Figure 7: Stock Price vs. Economic Book Value (EBV)
Sources: New Constructs, LLC and company filings.
Current Price Implies Another Historical Drop in Profits
Below, we use our reverse DCF model to quantify the cash flow expectations baked into PACCAR’s current stock price. Then, we analyze the implied value of the stock based on different assumptions about COVID-19’s impact on the truck market and PACCAR’s future growth in cash flows.
Scenario 1: Using expected revenue declines, historical margins, and average historical growth rates, we can model the worst-case scenario already implied by PACCAR’s current stock price. In this scenario, we assume:
- NOPAT margins fall to 3.8% (average from 2008-2010) in 2020-2022 and increase to 7% (10-year average compared to 9% TTM) in 2023 and each year thereafter
- Revenue falls 37% (equal to consensus estimates, which are even worse than S&P Global’s expected decline in overall heavy-duty truck sales) in 2020 and does not grow until 2023 (vs. consensus estimates for +20% and +21% in 2021 and 2022)
- Sales begin growing again in 2023, but only at 7% a year, which is half the expected CAGR of the North American truck market, and below PACCAR’s 10-year revenue CAGR (12%).
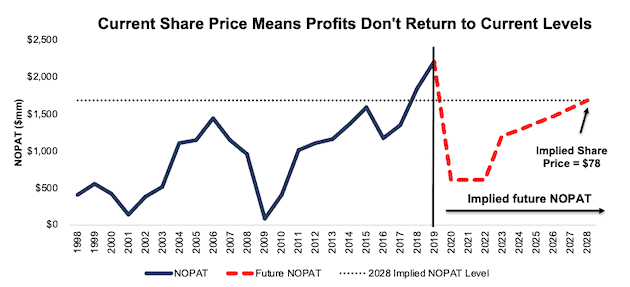
In this scenario, where PACCAR’s NOPAT declines 3% compounded annually over the next nine years (including a 72% YoY drop in 2020), the stock is worth $78/share today – nearly equal to the current stock price. See the math behind this reverse DCF scenario.
For reference, PACCAR’s NOPAT dropped 90% YoY in 2009 before more than quadrupling YoY in 2010 and surpassing 2008 levels by 2011.
Figure 8 compares the firm’s implied future NOPAT in this scenario to its historical NOPAT. This worst-case scenario implies PACCAR’s NOPAT nine years from now will be 24% below its 2019 NOPAT. In other words, this scenario implies that nine years after the COVID-19 pandemic, PACCAR’s profits won’t have recovered to levels achieved in both 2018 and 2019, and only 6% higher than profits achieved in 2015.
Furthermore, PACCAR’s average annual NOPAT during the nine years in this scenario is over $1.2 billion, which is 19% below the $1.4 billion average annual NOPAT the firm earned over the prior nine years (2019-2011). In any scenario better than this one, PCAR holds significant upside potential, as we’ll show.
Figure 8: Current Valuation Implies Severe, Long-Term Decline in Profits: Scenario 1
Sources: New Constructs, LLC and company filings.
Scenario 2: Moderate Long-Term Recovery Could Be Very Profitable
If we assume, as does the IMF and nearly every economist in the world, that the global economy rebounds and returns to growth starting in 2021, PCAR is undervalued.
In this scenario, we assume:
- NOPAT margins fall to 3.8% (average from 2008-2010) in 2020, increase to 7% (10-year average compared to 9% TTM) in 2021-2024, and then to 9% (equal to TTM) in 2025 and each year thereafter
- Revenue falls 37% (equal to consensus estimates) in 2020
- Revenue grows by 20% in 2021 and 21% in 2022 (consensus estimates), and 3.5% a year in 2023 and each year thereafter, which is equal to the average global GDP growth rate since 1961
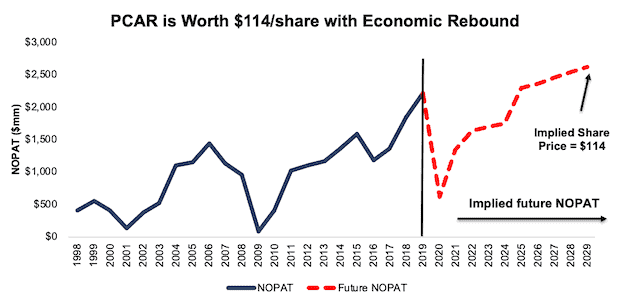
In this scenario, PACCAR’s NOPAT only grows by 2% compounded annually over the next decade (including a 72% YoY drop in 2020) and the stock is worth $114/share today – a 46% upside to the current price. See the math behind this reverse DCF scenario.
For comparison, PACCAR grew NOPAT by 10% compounded annually over the past five years, 38% compounded annually over the past decade, and 7% compounded annually over the past two decades. It’s not often investors get the opportunity to buy a market leader at such a discounted price.
Figure 9 compares the firm’s implied future NOPAT in this scenario to its historical NOPAT.
Figure 9: Implied Profits Assuming Moderate Recovery: Scenario 2
Sources: New Constructs, LLC and company filings.
Sustainable Competitive Advantages Will Drive Shareholder Value Creation
Here’s a summary of why we think the moat around PACCAR’s business will enable it to continue to generate higher NOPAT than the current market valuation implies. The following competitive advantages help PACCAR survive the downturn and return to growth as the economy grows again:
- Strong balance sheet and liquidity to survive a prolonged economic downturn
- Growing market share in the U.S., Canada, and Europe
- Greater capital efficiency and ROIC than peers
- Executive compensation plan that incentivizes prudent capital management
What Noise Traders Miss with PACCAR
These days, fewer investors focus on finding quality capital allocators with shareholder friendly corporate governance. Instead, due to the proliferation of noise traders, the focus is on short-term technical trading trends while high-quality fundamental research is overlooked. Here’s a quick summary of what noise traders are missing:
- Strong core earnings growth over the past two decades
- Long-term demand for light-, medium-, and heavy-duty trucks
- Valuation implies the economy never recovers and profits permanently decline by 30%
Dividends and Repurchases Provide Nearly 5% Yield
PACCAR returns capital to shareholders through quarterly and special dividends. Combined, the firm has increased its dividends paid from $2.32/share in 2015 to $3.58/share in 2019, or 11% compounded annually. The special dividend has increased from $1.40/share to $2.30/share and the quarterly dividend has increased from $0.24/share to $0.32/share over the same time. By itself, the $0.32/share quarterly dividend, when annualized, provides investors with a 1.6% dividend yield. However, that yield greatly increases when including the special dividend. If we annualized the quarterly dividend, and assume the special dividend stays constant with 2019, the total dividend yield to investors is 4.5%.
Importantly, from 2015 to 2019, the firm generated more in in free cash flow ($6.3 billion) than it paid out in dividends ($4.0 billion), or an average $467 million surplus each year. Firms with cash flows greater than dividend payments have a higher likelihood to maintain and grow dividends.
In addition to dividends, PACCAR has returned capital to shareholders through share repurchases. In 2018 and 2019, PACCAR repurchased a combined $465 million (2% of current market cap) worth of shares. At the end of 1Q20, PACCAR was authorized to repurchase an additional $390 million. The firm repurchases about $110 million per year, which equates to a 0.4% yield. The repurchase and dividend yields combine to equal a total yield of 4.9%.
A Consensus Beat or Signs of Recovery Could Send Shares Higher
According to Zacks, consensus estimates at the end of January pegged PACCAR’s 2020 EPS at $5.46/share. Jump forward to July 15, and consensus estimates have fallen to $2.83/share. 2021 estimates follow a similar trend. At the end of January, 2021 EPS consensus was $5.70/share, which has since fallen to $4.560/share.
Though the COVID shutdowns will diminish demand for new light-, medium-, and heavy-duty trucks in the short-term, these lowered expectations provide a great opportunity for a strong business, such as PACCAR, to beat consensus, if not this quarter, then maybe the next. While our current Earnings Distortion Score, which is a short-term indicator of the likelihood to beat or miss expectations, for PACCAR is “Miss”, lowered expectations moving forward could make it much easier to beat earnings.
PACCAR has beat consensus estimates in 10 of the past 12 quarters and doing so again amidst so much economic uncertainty could send shares higher. Additionally, any signs of recovery in the global economy, such as the expected return to growth in the heavy-duty truck market, would be another positive for the stock.
Insider Trading and Short Interest Trends
Over the past 12 months, insiders have bought 21 thousand shares and sold 193 thousand shares for a net effect of 173 thousand shares sold. These sales represent less than 1% of shares outstanding.
There are currently 4 million shares sold short, which equates to 1% of shares outstanding and just over two days to cover. Short interest is down 7% from the prior month. It’s clear investors are unwilling to bet against PACCAR returning to profit growth in the future.
Critical Details Found in Financial Filings by Our Robo-Analyst Technology
As investors focus more on fundamental research, research automation technology is needed to analyze all the critical financial details in financial filings as shown in the Harvard Business School and MIT Sloan paper, "Core Earnings: New Data and Evidence”.
Below are specifics on the adjustments we make based on Robo-Analyst findings in PACCAR’s 2019 10-K:
Income Statement: we made $199 million of adjustments, with a net effect of removing $179 million in non-operating income (<1% of revenue). You can see all the adjustments made to PACCAR’s income statement here.
Balance Sheet: we made $5.7 billion of adjustments to calculate invested capital with a net decrease of $2.9 million. One of the largest adjustments was $1.1billion in other comprehensive income. This adjustment represented 9% of reported net assets. You can see all the adjustments made to PACCAR’s balance sheet here.
Valuation: we made $3.8 billion of adjustments with a net effect of increasing shareholder value by $2.4 billion. The largest adjustment to shareholder value was $3.1 billion in excess cash. This adjustment represents 11% of PACCAR’s market cap. See all adjustments to PACCAR’s valuation here.
Attractive Funds That Hold PCAR
The following funds receive our Attractive-or-better rating and allocate significantly to PACCAR:
- Great Lakes Large Cap Value Fund (GLLIX) – 3.0% allocation and Very Attractive rating
- FMI Large Cap Fund (FMIQX) – 2.7% allocation and Very Attractive rating
- DWS CROCI Equity Dividend Fund (KDHAX) – 2.6% allocation and Very Attractive rating
- DWS CROCI U.S. Fund (DCUSX) – 2.5% allocation and Very Attractive rating
- Hennessy Cornerstone Large Growth Fund (HFLGX) – 2.2% allocation and Very Attractive rating
- Invesco Zacks Mid-Cap ETF (CZA) – 2.2% allocation and Attractive rating
- First Trust Capital Strength ETF (FTCS) – 2.1% allocation and Attractive rating
- Principal Active Global Dividend Income ETF (GDVD) – 2.0% allocation and Very Attractive rating
This article originally published on July 20, 2020.
Disclosure: David Trainer, Kyle Guske II, and Matt Shuler receive no compensation to write about any specific stock, style, or theme.
Follow us on Twitter, Facebook, LinkedIn, and StockTwits for real-time alerts on all our research.
[1] Our core earnings are a superior measure of profits, as demonstrated in Core Earnings: New Data & Evidence a paper by professors at Harvard Business School (HBS) & MIT Sloan. The paper empirically shows that our data is superior to “Operating Income After Depreciation” and “Income Before Special Items” from Compustat, owned by S&P Global (SPGI).
[2] Peers in this analysis include AGCO Corporation (AGCO), Alamo Group Inc. (ALG), Allison Transmission Holdings (ALSN), Astec Industries (ASTE), Caterpillar Inc. (CAT), Columbus McKinnon Corp (CMCO), Deere & Company (DE), Douglas Dynamics (PLOW), Federal Signal Corp (FSS), Foster L.B. Company (FSTR), Freightcar America (RAIL), Greenbrier Companies (GBX), Lindsay Corporation (LNN), Manitowoc Co. (MTW), Navistar International (NAV), Oshkosh Corporation (OSK), Terex Corporation (TEX), The Toro Company (TTC), Titan Machinery (TITN), Wabash National Corp (WNC), Westinghouse Air Brake Technologies (WAB).