We published an update to this Danger Zone pick on July 20, 2022. A copy of the associated Earnings Update report is here.
Tilray Inc. (TLRY: $15/share midpoint of IPO price range), Canadian marijuana producer and processor, will IPO on Thursday, July 19. At a price range of $14 to $16 per share, the company plans to raise up to $144 million and has an expected market cap of ~$1.4 billion. At the midpoint of its price range, TLRY currently earns our Unattractive rating.
Tilray looks to capitalize on growing support for the legalization of marijuana usage. 30 states in the U.S. have some form of legal marijuana and Canada recently approved a bill to legalize recreational usage, which would make it the first Group of Seven nation to legalize cannabis. Is Tilray’s IPO coming at the perfect time, or are the expectations baked into the stock price already too optimistic?
This report aims to help investors sort through Tilray’s financial filings to understand the fundamentals and valuation of this IPO.
GAAP Net Income Hides Growing Losses
TLRY earns revenues by through selling finished cannabis products direct to consumers and through pharmaceutical distributors. The company notes it harvested 6,779 kilos of cannabis in 2017, which is up from 4,526 kilos in 2016. It also notes its products are available through a division of Novartis pharmacies in Canada and also available in Germany, Argentina, Australia, Brazil, Chile, Croatia, Cyprus, the Czech Republic, New Zealand, and South Africa.
At first glance, TLRY’s GAAP net loss shrunk ever so slightly from -$7.9 million in 2016 to -$7.8 million in 2017. However, after-tax operating profit (NOPAT) fell from -$6.8 million to -$7.3 million over the same time.
Figure 1: TLRY GAAP Net Income and NOPAT Since 2016

Sources: New Constructs, LLC and company filings
Non-operating items overstated TLRY’s GAAP losses in 2017, which caused the appearance of shrinking losses versus NOPAT. We remove both non-operating income and expense when calculating NOPAT to get at the true recurring profits of the business.
In 2016, Robo-Analyst[1] uncovered non-operating items, such as:
- $0.2 million (2% of revenue) in inventory write-downs
- $0.8 million (6% of revenue) in reported non-operating expenses
After these adjustments, we removed net $1.1 million in non-operating expenses in 2016, which resulted in net operating loss after tax being 14% less than GAAP net loss. This overstated GAAP net loss in 2016 created an easier comp in 2017, which allowed TLRY to report shrinking losses while the true recurring profits of the business worsened.
With only two years of history, it’s hard to draw any firm conclusions about the long-term trend in profitability for TLRY, but our adjustments show that growing losses are masked by GAAP numbers.
Investors Betting on Continued Regulatory Approval Worldwide
As Tilray points out in its S-1, the world is in the middle of a paradigm shift regarding cannabis, from a state of prohibition to one of legalization. Such a shift would represent significant opportunity for a firm with proven production and distribution platforms. The United Nations estimates the total market (including illegal sales) could be worth up to $150 billion annually, with only 3.8% of the adult population currently using cannabis products.
Furthermore, Tilray notes that while still heavily regulated, medical marijuana is authorized in 29 countries. 25 countries alone have introduced significant reforms to their cannabis use laws since 2015. This shift has allowed Tilray to rapidly grow its revenues, and investors getting in on the IPO are betting such regulatory easing continues.
Expense Growth Must be Contained to Reach Profitability
Despite impressive revenue growth, Tilray’s expenses grew even faster in 2017. This trend must be reversed for the firm to achieve long-term profitability. In 2017, revenue grew 62% year-over-year (YoY), which is certainly indicative of the growth potential of the business. However, research & development, sales & marketing, and general & administrative costs grew 179%, 99% and 71% YoY respectively.
The only place where Tilray is seeing economies of scale is in production. Its average cost per gram sold declined from $4.04 in 2016 to $2.84 in 2017. These declining costs helped the company more than double its gross margin, from 21% to 55%.
Easing regulations, such as in the United States (estimated to generate $22 billion in marijuana sales by 2022), could be the opportunity for Tilray to truly capitalize on its first mover advantage in the cannabis market. It already has an e-commerce platform within Canada, which could help in getting similar approvals in other countries. Similarly, it was the first company to legally export medical cannabis from North America to Africa, Australia, Europe, and South America.
These distribution channels could be a long-term advantage for the company, but the costs associated with them also cancel out many of the benefits of improved production efficiency in the near term.
TLRY Looks Undervalued by Traditional Metrics
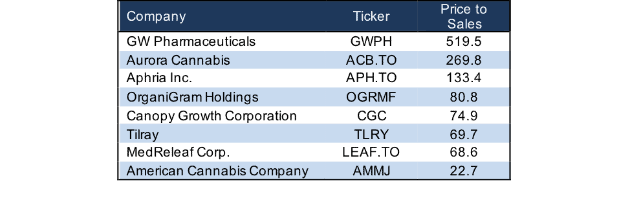
Figure 2 shows the price-to-sales ratio for other publicly traded cannabis related companies. As can be seen, TLRY’s price-to-sales ratio is actually below many peer firms. However, it is worth noting that each of these firms looks vastly overvalued relative to the overall market (S&P 500), which has a price-to-sales ratio of 2.2.
Figure 2: Valuations for Cannabis Companies
Sources: New Constructs, LLC and company filings
Our Discounted Cash Flow Model Reveals TLRY is Overvalued
When we analyze the cash flow expectations baked into the stock price, we find that TLRY is overvalued at the midpoint of its IPO, despite what traditional metrics show. Our dynamic DCF model quantifies exactly what kind of future cash flows the market price of a stock implies a company will generate.
To justify the midpoint IPO price of $15/share, TLRY must immediately achieve 6% NOPAT margins (comparable to the average of other agriculture/farming companies such as Fresh Del Monte (FDP), Calavo Growers (CVGW), The Andersons (ANDE), and Limoneira (LMNR)) and grow revenue by 45% compounded annually for the next 13 years. See the math behind this dynamic DCF scenario. For reference, TLRY’s NOPAT margin was -35% in 2017 so this scenario implies immediate and drastic improvements in profitability.
Even if we assume TLRY can earn higher margins, due to cannabis being more valuable than standard crops, the stock still holds significant downside. If we assume TLRY can achieve a 10% NOPAT margin and grow revenue by 40% compounded annually for the next decade, the stock is worth just $6/share today – a 60% downside from the IPO midpoint. See the math behind this dynamic DCF scenario.
Share Class Structure Leaves Little Power for Investors
Tilray plans to list shares using a dual class structure, something we’ve seen from the likes of previous IPO’s Snapchat (SNAP) and Dropbox (DBX). Class 2 stock, which is being sold in the IPO, will grant investors one vote per share. Class 1 stock, which is owned entirely by Privateer Holdings, will receive three votes per share owned. This structure gives Privateer Holdings 93% of the voting power post IPO, and Tilray will be a “controlled company” under the definition provided by the rules of NASDAQ listings.
This concentrated voting power means investors have little say on important matters, particularly in an industry that could see significant regulatory change and upheaval in years to come. While we’ve certainly seen worse corporate governance when it comes to voting rights, TLRY’s voting structure remains a red flag.
Critical Details Found in Financial Filings by Our Robo-Analyst Technology
As investors focus more on fundamental research, research automation technology is needed to analyze all the critical financial details in financial filings. Below are specifics on the adjustments[2] we make based on Robo-Analyst findings in Tilray’s 2017 S-1:
Income Statement: we made $3 million of adjustments, with a net effect of removing $1 million in non-operating expense (5% of revenue). We removed $1 million in non-operating income and $2 million in non-operating expenses. You can see all the adjustments made to TLRY’s income statement here.
Balance Sheet: we made $54 million of adjustments to calculate invested capital with a net increase of $32 million. The most notable adjustment was $4 million in other comprehensive income. This adjustment represented 104% of reported net assets. You can see all the adjustments made to TLRY’s balance sheet here.
Valuation: we made $56 million of adjustments with a net effect of decreasing shareholder value by $56 million. There were no adjustments that increased shareholder value. Apart from $51 million in total debt, the largest adjustment to shareholder value was $5 million in outstanding employee stock options. This option adjustment represents less than 1% of TLRY’s proposed market cap.
This article originally published on July 16, 2018.
Disclosure: David Trainer, Kyle Guske II, and Sam McBride receive no compensation to write about any specific stock, style, or theme.
Follow us on Twitter, Facebook, LinkedIn, and StockTwits for real-time alerts on all our research.
[1] Harvard Business School features the powerful impact of research automation in the case New Constructs: Disrupting Fundamental Analysis with Robo-Analysts.
[2] Ernst & Young’s recent white paper “Getting ROIC Right” demonstrates the link between an accurate calculation of ROIC and shareholder value.